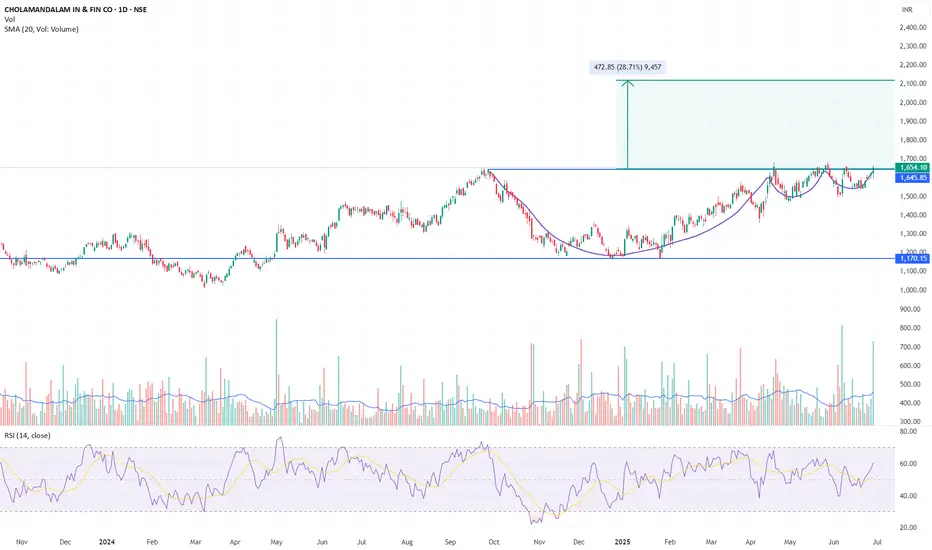
CHOLAFIN – Cup & Handle Breakout | Target ₹2120 (28% Upside)CHOLAMANDALAM FIN has confirmed a classic Cup and Handle breakout after 9 months of base formation. The neckline at ₹1645.85 has been cleanly crossed with strong follow-through and high volume.
Pattern Structure:
Cup Base: Formed between Sep–Dec 2024, bottomed near ₹1170
Handle: Shallow, cor
Next report date
—
Report period
—
EPS estimate
—
Revenue estimate
—
50.70 INR
42.63 B INR
261.53 B INR
422.93 M
About CHOLAMANDALAM IN & FIN CO
Sector
Industry
CEO
Ravindra Kumar Kundu
Website
Headquarters
Chennai
Founded
1978
ISIN
INE121A01024
FIGI
BBG000CQ08Y3
Cholamandalam Investment & Finance Co. Ltd. engages in the provision of financial services. It operates through the following segments: Vehicle Finance Loans, Loan Against Property, Home Loans, and Other Loans. The Vehicle Finance Loans segment includes loans to customers against purchase of new/used vehicles, tractors, construction equipment, and loan to automobile dealers. The Home Loans segment includes loans given for acquisition of residential property. The Loan Against Property segment includes loans to customer against immovable property. The Other Loans segment involves loans against shares and other unsecured loans. The company was founded on August 17, 1978 and is headquartered in Chennai, India.
Related stocks
Cholamandalam Investment and Finance Company (CHOLAFIN)I'm not a SEBI REGISTERED ANYLISIS
just for learning purpose
above the blue line close in D chart candle i will buy and put strictly SL to below red line...once candle close below Red line in D chart...i will close the Trade...
target check the chart
educational purpose only
its simple ORB W

CHOLAFIN CMP 1428.On daily candle it breaking a range with consolidation breakout.Finance sector also positive.YOY and QOQ company gaining it net profit and EPS.Currently trading at PE of 30.Add this to your portfolio for coming days.And see how it perform.Thank You.

Ready to move all time high'smake a higher highs stock in uptrend.
From 1530-1500 range can expect up move. till 1830 then you can trail later target

CHOLA FIN - SHORT TO MID TERM OUTLOOKChola fin is looking steady on charts and it has a good potential for upside in the short to medium term. The base level for upside would be 1485, and up on crossing this level, we can expect it to continue momentum upto levels of 1656-1716. On the downside, the important support area is 1415-1360,

Cholamandalam: Bouncing Back After Correction?Cholamandalam Investment & Finance Company has been recovering after a period of decline. The price had fallen around 14% from its highest level in the past year but recently showed signs of regaining strength.
A rounded formation can be seen where the stock gradually stopped falling and then start

Upcoming days Day by day downside flow Enter 1400 and above put side
Strong enter below 1320
Target 🎯 1 - 1200
Final target 🎯 - 1143
Stoploss 1398 day closing

CHOLAFIN - A clear triple bottomCHOLAFIN has formed a clear triple bottom.
Keep this stock in your watch list and watch-out for a break-out with strong volume around the upper blue line. ( Strong resistance)

Cholamandalam: Trendline Breakout with Bullish MomentumCholamandalam is showing a strong trendline breakout, trading at ₹1,320.25, up by 3.83% for the day. Here's a closer look at the recent price action:
📈 Technical Insights:
Downtrend Break: The stock has broken a long-standing downward trendline, suggesting a shift in market sentiment.
Volum

Chola Finance Forming Shark / CypherChola Finance is at verge to form M pattern of Shark / Cypher,
It has potential to go towards below targets as per pattern,
Target1: 1140
Target2: 1085
Target3: 1000
Weekly close is important to have above targets.

See all ideas
Summarizing what the indicators are suggesting.
Neutral
SellBuy
Strong sellStrong buy
Strong sellSellNeutralBuyStrong buy
Neutral
SellBuy
Strong sellStrong buy
Strong sellSellNeutralBuyStrong buy
Neutral
SellBuy
Strong sellStrong buy
Strong sellSellNeutralBuyStrong buy
An aggregate view of professional's ratings.
Neutral
SellBuy
Strong sellStrong buy
Strong sellSellNeutralBuyStrong buy
Neutral
SellBuy
Strong sellStrong buy
Strong sellSellNeutralBuyStrong buy
Neutral
SellBuy
Strong sellStrong buy
Strong sellSellNeutralBuyStrong buy
Displays a symbol's price movements over previous years to identify recurring trends.
86CIFC29
CIFCL-8.6%-31-1-29-NCDYield to maturity
13.76%
Maturity date
Jan 31, 2029
840CIFCL28
CIFCL-8.40%-4-5-28-NCDYield to maturity
9.14%
Maturity date
May 4, 2028
85CIFC27
CIFCL-8.5%-31-1-27-NCDYield to maturity
8.49%
Maturity date
Jan 31, 2027
830CIFC26
CIFCL-8.30%-4-6-26-NCDYield to maturity
8.30%
Maturity date
Jun 4, 2026
CIFCZC26
CIFCL-ZC-7-12-26-NCDYield to maturity
7.61%
Maturity date
Dec 7, 2026
850CIFCL26
CIFCL-8.50%-7-12-26-NCDYield to maturity
7.59%
Maturity date
Dec 7, 2026
860CIFCL28
CIFCL-8.60%-07-12-28-NCDYield to maturity
6.97%
Maturity date
Dec 7, 2028
84CIFCL28
CIFCL-8.4%-9-8-28-NCDYield to maturity
5.43%
Maturity date
Aug 9, 2028
875CIFC23B
CIFCL-8.45%-31-1-26-NCDYield to maturity
3.40%
Maturity date
Jan 31, 2026
888IHFL25F
CIFCL-8.40%-7-12-25-NCDYield to maturity
0.69%
Maturity date
Dec 7, 2025
925IHFL25E
CIFCL-8.3%-9-9-26-NCDYield to maturity
0.11%
Maturity date
Sep 9, 2026
See all CHOLAFIN bonds
Frequently Asked Questions
The current price of CHOLAFIN is 1,526.70 INR — it has decreased by −0.03% in the past 24 hours. Watch CHOLAMANDALAM IN & FIN CO stock price performance more closely on the chart.
Depending on the exchange, the stock ticker may vary. For instance, on NSE exchange CHOLAMANDALAM IN & FIN CO stocks are traded under the ticker CHOLAFIN.
CHOLAFIN stock has fallen by −6.17% compared to the previous week, the month change is a −1.80% fall, over the last year CHOLAMANDALAM IN & FIN CO has showed a 5.80% increase.
We've gathered analysts' opinions on CHOLAMANDALAM IN & FIN CO future price: according to them, CHOLAFIN price has a max estimate of 1,950.00 INR and a min estimate of 1,182.00 INR. Watch CHOLAFIN chart and read a more detailed CHOLAMANDALAM IN & FIN CO stock forecast: see what analysts think of CHOLAMANDALAM IN & FIN CO and suggest that you do with its stocks.
CHOLAFIN reached its all-time high on May 28, 2025 with the price of 1,684.40 INR, and its all-time low was 21.30 INR and was reached on Dec 22, 2011. View more price dynamics on CHOLAFIN chart.
See other stocks reaching their highest and lowest prices.
See other stocks reaching their highest and lowest prices.
CHOLAFIN stock is 2.01% volatile and has beta coefficient of 1.42. Track CHOLAMANDALAM IN & FIN CO stock price on the chart and check out the list of the most volatile stocks — is CHOLAMANDALAM IN & FIN CO there?
Today CHOLAMANDALAM IN & FIN CO has the market capitalization of 1.28 T, it has decreased by −0.48% over the last week.
Yes, you can track CHOLAMANDALAM IN & FIN CO financials in yearly and quarterly reports right on TradingView.
CHOLAMANDALAM IN & FIN CO is going to release the next earnings report on Jul 25, 2025. Keep track of upcoming events with our Earnings Calendar.
CHOLAFIN earnings for the last quarter are 15.04 INR per share, whereas the estimation was 14.33 INR resulting in a 4.96% surprise. The estimated earnings for the next quarter are 13.39 INR per share. See more details about CHOLAMANDALAM IN & FIN CO earnings.
CHOLAMANDALAM IN & FIN CO revenue for the last quarter amounts to 37.58 B INR, despite the estimated figure of 36.55 B INR. In the next quarter, revenue is expected to reach 38.73 B INR.
CHOLAFIN net income for the last quarter is 12.60 B INR, while the quarter before that showed 10.88 B INR of net income which accounts for 15.74% change. Track more CHOLAMANDALAM IN & FIN CO financial stats to get the full picture.
CHOLAMANDALAM IN & FIN CO dividend yield was 0.13% in 2024, and payout ratio reached 3.94%. The year before the numbers were 0.17% and 4.86% correspondingly. See high-dividend stocks and find more opportunities for your portfolio.
EBITDA measures a company's operating performance, its growth signifies an improvement in the efficiency of a company. CHOLAMANDALAM IN & FIN CO EBITDA is 84.81 B INR, and current EBITDA margin is 32.43%. See more stats in CHOLAMANDALAM IN & FIN CO financial statements.
Like other stocks, CHOLAFIN shares are traded on stock exchanges, e.g. Nasdaq, Nyse, Euronext, and the easiest way to buy them is through an online stock broker. To do this, you need to open an account and follow a broker's procedures, then start trading. You can trade CHOLAMANDALAM IN & FIN CO stock right from TradingView charts — choose your broker and connect to your account.
Investing in stocks requires a comprehensive research: you should carefully study all the available data, e.g. company's financials, related news, and its technical analysis. So CHOLAMANDALAM IN & FIN CO technincal analysis shows the sell today, and its 1 week rating is neutral. Since market conditions are prone to changes, it's worth looking a bit further into the future — according to the 1 month rating CHOLAMANDALAM IN & FIN CO stock shows the buy signal. See more of CHOLAMANDALAM IN & FIN CO technicals for a more comprehensive analysis.
If you're still not sure, try looking for inspiration in our curated watchlists.
If you're still not sure, try looking for inspiration in our curated watchlists.