Next report date
—
Report period
—
EPS estimate
—
Revenue estimate
—
40.60 INR
5.97 B INR
78.92 B INR
83.32 M
About GUJ NAR VAL FER & CHEM L
Sector
Industry
CEO
Thiruvenkadam Natarajan
Website
Headquarters
Bharuch
Founded
1976
ISIN
INE113A01013
FIGI
BBG000CS2XN4
Gujarat Narmada Valley Fertilizers & Chemicals Ltd. operates as a holding company, which engages in the manufacture and trade of fertilizers and industrial chemicals. It operates through the following segments: Chemicals, Fertilizers, and Others. The company was founded on May 10, 1976 and is headquartered in Bharuch, India.

Key Support / Resistance Breakout - Swing TradeDisclaimer: I am not a Sebi registered adviser.
This Idea is publish purely for educational purpose only before investing in any stocks please take advise from your financial adviser.
Key Support & Resistance Breakout. Stock has give Breakout of Resistance level. Keep in watch list. Buy above the h

GNFC--buy on dipwe are in last leg of correction every dip to be bought into for multiple return LRHR stock. 4th wave might end soon , once breaks out of contracting triangle will show more power

GNFC Ltd view for Intraday 3rd October #GNFC GNFC Ltd view for Intraday 3rd October #GNFC
Buying may witness above 703
Support area 693. Below ignoring buying momentum for intraday
Selling may witness below 693
Resistance area 700-703
Above ignoring selling momentum for intraday
Charts for Educational purposes only.
Please follow strict st

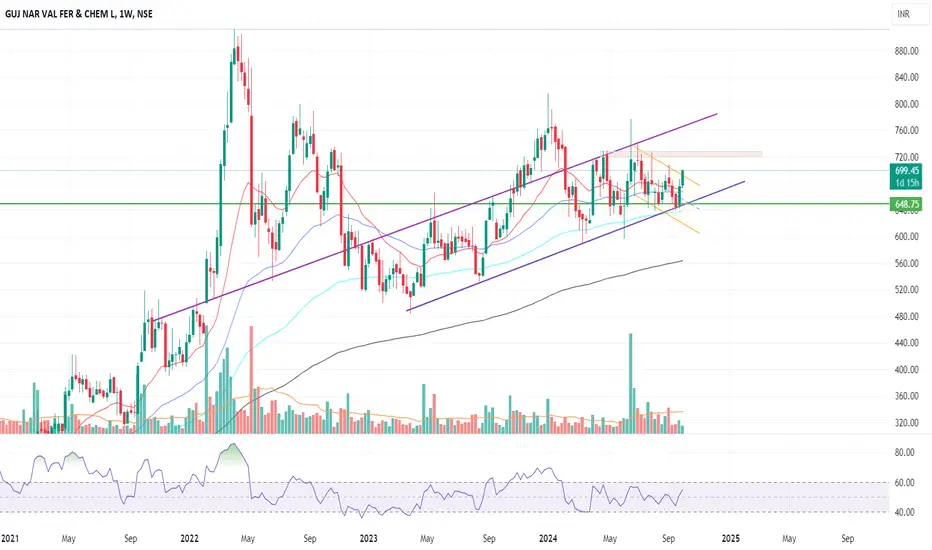
GNFC Weekly Chart AnalysisThe stock is trading within a long-term upward sloping channel , indicating a sustained uptrend. It recently bounced off the support level of 648.75, which aligns with the lower boundary of the channel, showing strong demand at this level. Additionally, the stock has broken out of a falling wedg


GNFC Ready to MOVE and will give Unbeatenable Returns 1st Target is 30%
2nd Target is 70%
and will hold for long term as well to get good risk reward ratio.
Note : This is only purely for educational purpose and i am not an SEBI Registered

gnfc share for swing tradegnfc share is break down trend channel in short term. if it go up then firs target 740+.stop loss also mentioned in chart

Breakout?Do you think this stock is poised for a breakout, or could it see a rejection at this level? Interested to hear your thoughts on whether it's a good time to enter or wait for confirmation!"

See all ideas
Summarizing what the indicators are suggesting.
Oscillators
Neutral
SellBuy
Strong sellStrong buy
Strong sellSellNeutralBuyStrong buy
Oscillators
Neutral
SellBuy
Strong sellStrong buy
Strong sellSellNeutralBuyStrong buy
Summary
Neutral
SellBuy
Strong sellStrong buy
Strong sellSellNeutralBuyStrong buy
Summary
Neutral
SellBuy
Strong sellStrong buy
Strong sellSellNeutralBuyStrong buy
Summary
Neutral
SellBuy
Strong sellStrong buy
Strong sellSellNeutralBuyStrong buy
Moving Averages
Neutral
SellBuy
Strong sellStrong buy
Strong sellSellNeutralBuyStrong buy
Moving Averages
Neutral
SellBuy
Strong sellStrong buy
Strong sellSellNeutralBuyStrong buy
Displays a symbol's price movements over previous years to identify recurring trends.
Related stocks
Frequently Asked Questions
The current price of GNFC is 520.00 INR — it has decreased by −1.64% in the past 24 hours. Watch GUJ NAR VAL FER & CHEM L stock price performance more closely on the chart.
Depending on the exchange, the stock ticker may vary. For instance, on NSE exchange GUJ NAR VAL FER & CHEM L stocks are traded under the ticker GNFC.
GNFC stock has fallen by −4.08% compared to the previous week, the month change is a 3.48% rise, over the last year GUJ NAR VAL FER & CHEM L has showed a −26.76% decrease.
GNFC reached its all-time high on Apr 5, 2022 with the price of 912.00 INR, and its all-time low was 11.00 INR and was reached on Mar 8, 1999. View more price dynamics on GNFC chart.
See other stocks reaching their highest and lowest prices.
See other stocks reaching their highest and lowest prices.
GNFC stock is 3.02% volatile and has beta coefficient of 1.33. Track GUJ NAR VAL FER & CHEM L stock price on the chart and check out the list of the most volatile stocks — is GUJ NAR VAL FER & CHEM L there?
Today GUJ NAR VAL FER & CHEM L has the market capitalization of 78.03 B, it has increased by 6.06% over the last week.
Yes, you can track GUJ NAR VAL FER & CHEM L financials in yearly and quarterly reports right on TradingView.
GUJ NAR VAL FER & CHEM L is going to release the next earnings report on Aug 11, 2025. Keep track of upcoming events with our Earnings Calendar.
GNFC net income for the last quarter is 2.11 B INR, while the quarter before that showed 1.63 B INR of net income which accounts for 29.45% change. Track more GUJ NAR VAL FER & CHEM L financial stats to get the full picture.
Yes, GNFC dividends are paid annually. The last dividend per share was 16.50 INR. As of today, Dividend Yield (TTM)% is 3.11%. Tracking GUJ NAR VAL FER & CHEM L dividends might help you take more informed decisions.
EBITDA measures a company's operating performance, its growth signifies an improvement in the efficiency of a company. GUJ NAR VAL FER & CHEM L EBITDA is 6.15 B INR, and current EBITDA margin is 7.70%. See more stats in GUJ NAR VAL FER & CHEM L financial statements.
Like other stocks, GNFC shares are traded on stock exchanges, e.g. Nasdaq, Nyse, Euronext, and the easiest way to buy them is through an online stock broker. To do this, you need to open an account and follow a broker's procedures, then start trading. You can trade GUJ NAR VAL FER & CHEM L stock right from TradingView charts — choose your broker and connect to your account.
Investing in stocks requires a comprehensive research: you should carefully study all the available data, e.g. company's financials, related news, and its technical analysis. So GUJ NAR VAL FER & CHEM L technincal analysis shows the sell today, and its 1 week rating is sell. Since market conditions are prone to changes, it's worth looking a bit further into the future — according to the 1 month rating GUJ NAR VAL FER & CHEM L stock shows the sell signal. See more of GUJ NAR VAL FER & CHEM L technicals for a more comprehensive analysis.
If you're still not sure, try looking for inspiration in our curated watchlists.
If you're still not sure, try looking for inspiration in our curated watchlists.