28.55 INR
1.97 B INR
20.45 B INR
18.21 M
About RAMKY INFRA LTD
Sector
Industry
CEO
Ratnakara Nagaraja Yancharla
Website
Headquarters
Hyderabad
Founded
1994
ISIN
INE874I01013
FIGI
BBG000V1QZL3
Ramky Infrastructure Ltd. engages in construction and infrastructure development. It operates through the following segments: Construction Business, Developer Business, and Other. The Construction Business segment engages in engineering, procurement, and construction contracts. The Developer Business segment engages in construction and development of real estate properties. The company was founded by Alla Ayodhya Rami Reddy on April 13, 1994 and is headquartered in Hyderabad, India.
Related stocks
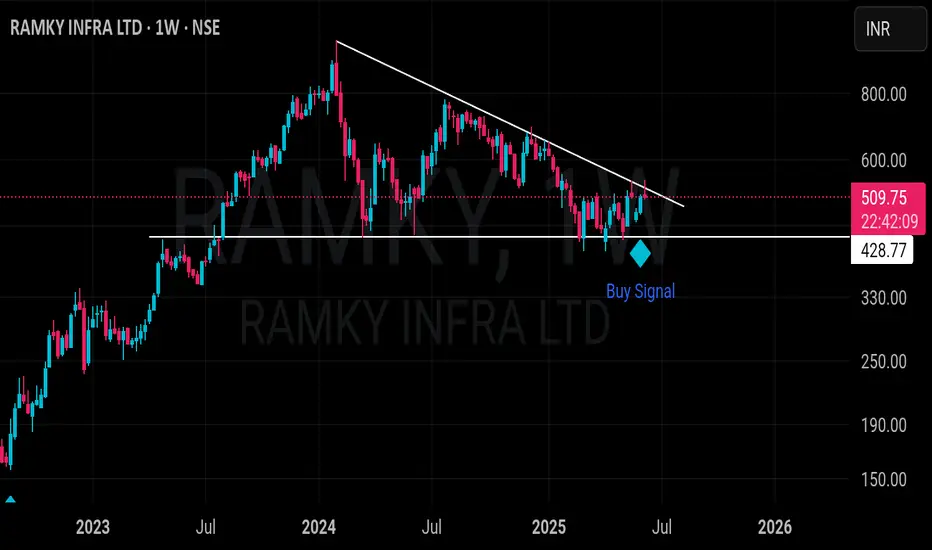
RAMKAY INFRA technical analysis Ramky Infrastructure Ltd. (NSE: RAMKY) is currently trading at INR 510. The company operates in the engineering and infrastructure development sector, specializing in environmental services, real estate, and industrial projects across India.
Key Levels
Support Levels: INR 312.90, INR 461.70, INR 54

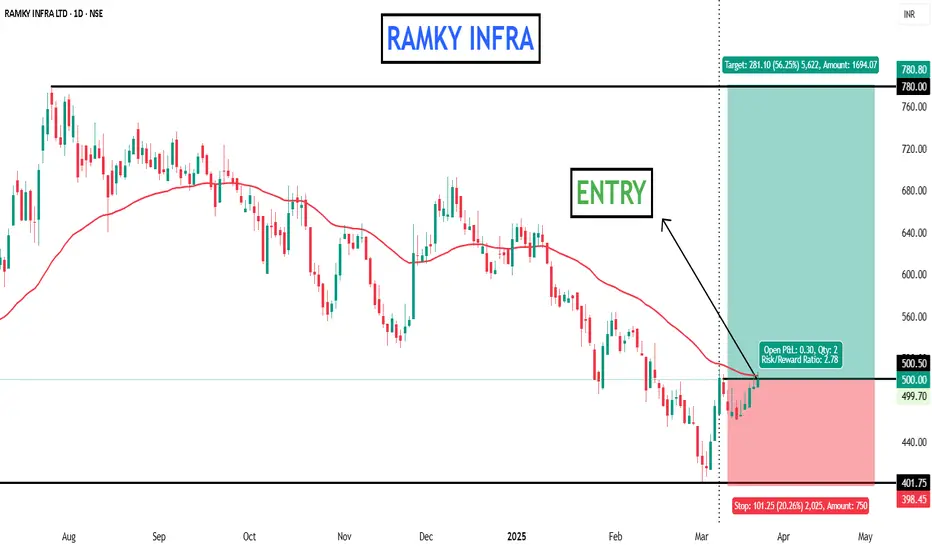
FIRST ENTRY INITIATED - RAMKY INFRA LTDEverything is pretty much explained in the picture itself.
I am Abhishek Srivastava | SEBI-Certified Research and Equity Derivative Analyst from Delhi with 4+ years of experience.
I focus on simplifying equity markets through technical analysis. On Trading View, I share easy-to-understand
RAMKY gives brake out on daily chart.NSE:RAMKY
RAMKY gives brake out on daily chart.
I am buying this stock
Near 700-710
And follow sl on 550
My target will be 950
My risk reward ratio is 1:1.50
Return on capital 35%

positional idea with pros and consPros
-Prior uptrend
-Weekly Base
-reduced debt
-Huge volumes on green days
-Tight consolidation of 5 weeks in base
-Low vol in base formation
-Above 40 WEMA
Cons:
-Overhead supply
-Low RS

Long setup in Ramky InfraTargets are Big as shown in the chart..
Short term trader can buy with SL of 80 and long term investors go with SL below 60 on WCB
I am not a full time analyst, I just post my ideas only to help others. Remember it is your capital and R&R always


13 years breakout 13-year breakout with huge volume followed by weekly follow-up and having a good order book which is twice the market cap. Weekly followup shows strength in the stock.

Resistance BreakoutPlease look into the chart for a detailed understanding.
Consider these for short-term & swing trades with 2% profit.
For BTST trades consider booking
target for 1% - 2%
For long-term trades look out for resistance drawn above closing.
Please consider these ideas for educational purpose

See all ideas
Summarizing what the indicators are suggesting.
Oscillators
Neutral
SellBuy
Strong sellStrong buy
Strong sellSellNeutralBuyStrong buy
Oscillators
Neutral
SellBuy
Strong sellStrong buy
Strong sellSellNeutralBuyStrong buy
Summary
Neutral
SellBuy
Strong sellStrong buy
Strong sellSellNeutralBuyStrong buy
Summary
Neutral
SellBuy
Strong sellStrong buy
Strong sellSellNeutralBuyStrong buy
Summary
Neutral
SellBuy
Strong sellStrong buy
Strong sellSellNeutralBuyStrong buy
Moving Averages
Neutral
SellBuy
Strong sellStrong buy
Strong sellSellNeutralBuyStrong buy
Moving Averages
Neutral
SellBuy
Strong sellStrong buy
Strong sellSellNeutralBuyStrong buy
Displays a symbol's price movements over previous years to identify recurring trends.
Frequently Asked Questions
The current price of RAMKY is 575.90 INR — it has decreased by −1.92% in the past 24 hours. Watch RAMKY INFRA LTD stock price performance more closely on the chart.
Depending on the exchange, the stock ticker may vary. For instance, on NSE exchange RAMKY INFRA LTD stocks are traded under the ticker RAMKY.
RAMKY stock has fallen by −4.05% compared to the previous week, the month change is a −0.50% fall, over the last year RAMKY INFRA LTD has showed a −24.92% decrease.
RAMKY reached its all-time high on Feb 2, 2024 with the price of 1,009.05 INR, and its all-time low was 15.05 INR and was reached on Mar 25, 2020. View more price dynamics on RAMKY chart.
See other stocks reaching their highest and lowest prices.
See other stocks reaching their highest and lowest prices.
RAMKY stock is 3.32% volatile and has beta coefficient of 1.87. Track RAMKY INFRA LTD stock price on the chart and check out the list of the most volatile stocks — is RAMKY INFRA LTD there?
Today RAMKY INFRA LTD has the market capitalization of 39.83 B, it has decreased by −4.10% over the last week.
Yes, you can track RAMKY INFRA LTD financials in yearly and quarterly reports right on TradingView.
RAMKY net income for the last quarter is −46.48 M INR, while the quarter before that showed 563.75 M INR of net income which accounts for −108.24% change. Track more RAMKY INFRA LTD financial stats to get the full picture.
No, RAMKY doesn't pay any dividends to its shareholders. But don't worry, we've prepared a list of high-dividend stocks for you.
EBITDA measures a company's operating performance, its growth signifies an improvement in the efficiency of a company. RAMKY INFRA LTD EBITDA is 3.36 B INR, and current EBITDA margin is 16.45%. See more stats in RAMKY INFRA LTD financial statements.
Like other stocks, RAMKY shares are traded on stock exchanges, e.g. Nasdaq, Nyse, Euronext, and the easiest way to buy them is through an online stock broker. To do this, you need to open an account and follow a broker's procedures, then start trading. You can trade RAMKY INFRA LTD stock right from TradingView charts — choose your broker and connect to your account.
Investing in stocks requires a comprehensive research: you should carefully study all the available data, e.g. company's financials, related news, and its technical analysis. So RAMKY INFRA LTD technincal analysis shows the sell today, and its 1 week rating is buy. Since market conditions are prone to changes, it's worth looking a bit further into the future — according to the 1 month rating RAMKY INFRA LTD stock shows the buy signal. See more of RAMKY INFRA LTD technicals for a more comprehensive analysis.
If you're still not sure, try looking for inspiration in our curated watchlists.
If you're still not sure, try looking for inspiration in our curated watchlists.