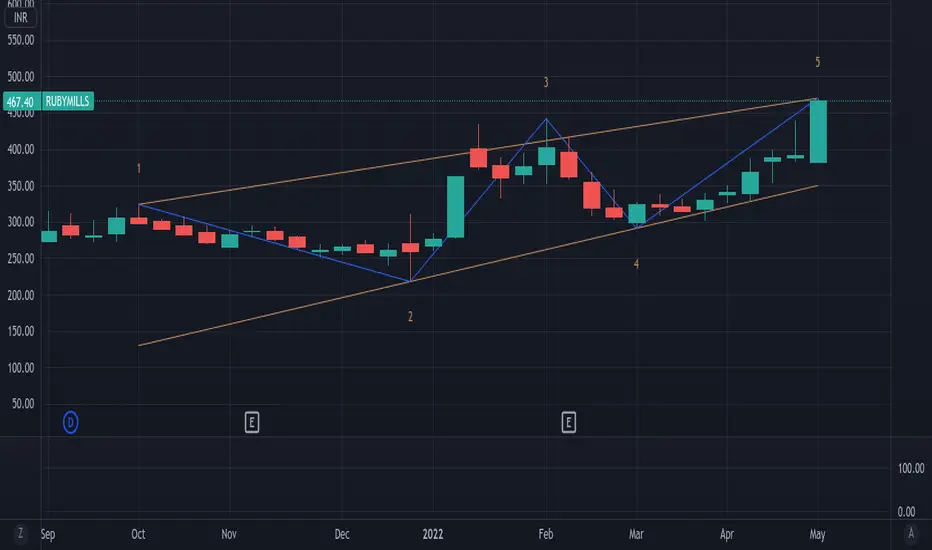
SWING IDEA - RUBYMILLSStock NSE:RUBYMILLS is currently at a Breakout Zone of 263 in the weekly timeframe. Also currently at its 52W High as well.
MACD line and Signal have a fair enough split between each other, which also indicates a good bullish momentum.
If market conditions are good, this stock should easily revisi
12.66 INR
423.13 M INR
2.43 B INR
7.07 M
About THE RUBY MILLS LTD
Sector
Industry
CEO
Purav Hiren Shah
Website
Headquarters
Mumbai
Founded
1917
ISIN
INE301D01026
FIGI
BBG000CYTT88
Ruby Mills Ltd. engages in the manufacturing of textile and renting of properties. It operates through the Textile and Real Estate segment. Its products include fabrics, industrial textiles, institutional supply, functional textiles, and fancy fabrics. The company was founded in 1917 and is headquartered in Mumbai, India.

50 SMA Rising- Positional TradeDisclaimer: I am not a Sebi registered adviser.
This Idea is publish purely for educational purpose only before investing in any stocks please take advise from your financial adviser.
Its 50 SMA Rising Strategy. Suitable for Positional Trading Initial Stop loss lowest of last 2 candles and keep tra

RUBYMILLS cmp 260.PE is 19,Price to book value is less than 2.Net profittable from last 4 quarters. possible a good upside movement.

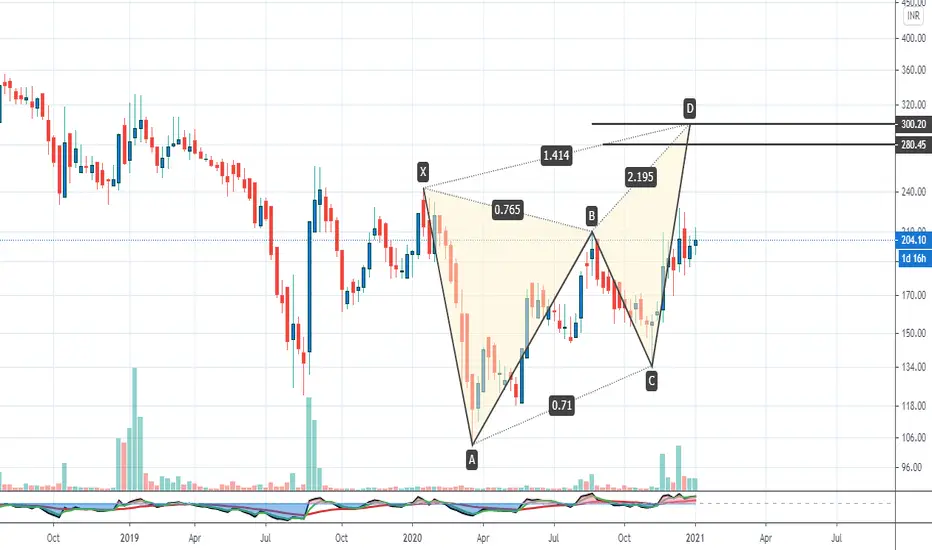
Ruby millsRuby mills is in good pattern, cn touch 330…380..414 as inmediate targets. Keep on radar positionally !

RUBYMILLS - Bullish Setup Stock name - Ruby Mills Limited.
Weekly chart setup
Chart is self explanatory. Levels of breakout, possible up-moves (where stock may find resistances) and support (close below which, setup will be invalidated) are clearly defined.
Master Score - C
Disclaimer: This is for demonstration and educati


ruby mills watch for channel breakoutchannel breakout on weekly charts
rounding pattern on daily charts
no excessive debt , intrinsic value high
p/e 25 , revenue not stable
for education purposes only
Rubby Mills IndiaSun Storm Investment Trading Desk & NexGen Wealth Management Service Present's: SSITD & NexGen Portfolio of the Week Series
Focus: Worldwide
By Sun Storm Investment Research & NexGen Wealth Management Service
A Profit & Solutions Strategy & Research
Trading | Investment | Stocks | ETF | Mutua

RUBY MILLSBreakout. Targets 318-320. Sl 290.
Above ideas are for educational purposes only, kindly consult your financial advisor before investing.
Please don’t forget to like and subscribe if you like the idea.

See all ideas
Summarizing what the indicators are suggesting.
Oscillators
Neutral
SellBuy
Strong sellStrong buy
Strong sellSellNeutralBuyStrong buy
Oscillators
Neutral
SellBuy
Strong sellStrong buy
Strong sellSellNeutralBuyStrong buy
Summary
Neutral
SellBuy
Strong sellStrong buy
Strong sellSellNeutralBuyStrong buy
Summary
Neutral
SellBuy
Strong sellStrong buy
Strong sellSellNeutralBuyStrong buy
Summary
Neutral
SellBuy
Strong sellStrong buy
Strong sellSellNeutralBuyStrong buy
Moving Averages
Neutral
SellBuy
Strong sellStrong buy
Strong sellSellNeutralBuyStrong buy
Moving Averages
Neutral
SellBuy
Strong sellStrong buy
Strong sellSellNeutralBuyStrong buy
Displays a symbol's price movements over previous years to identify recurring trends.
Related stocks
Frequently Asked Questions
The current price of RUBYMILLS is 217.19 INR — it has decreased by −0.23% in the past 24 hours. Watch THE RUBY MILLS LTD stock price performance more closely on the chart.
Depending on the exchange, the stock ticker may vary. For instance, on NSE exchange THE RUBY MILLS LTD stocks are traded under the ticker RUBYMILLS.
RUBYMILLS stock has risen by 4.72% compared to the previous week, the month change is a 6.99% rise, over the last year THE RUBY MILLS LTD has showed a 4.75% increase.
RUBYMILLS reached its all-time high on Sep 14, 2022 with the price of 369.00 INR, and its all-time low was 8.60 INR and was reached on Oct 9, 2003. View more price dynamics on RUBYMILLS chart.
See other stocks reaching their highest and lowest prices.
See other stocks reaching their highest and lowest prices.
RUBYMILLS stock is 4.12% volatile and has beta coefficient of 2.10. Track THE RUBY MILLS LTD stock price on the chart and check out the list of the most volatile stocks — is THE RUBY MILLS LTD there?
Today THE RUBY MILLS LTD has the market capitalization of 7.30 B, it has decreased by −0.76% over the last week.
Yes, you can track THE RUBY MILLS LTD financials in yearly and quarterly reports right on TradingView.
RUBYMILLS net income for the last quarter is 160.10 M INR, while the quarter before that showed 147.02 M INR of net income which accounts for 8.90% change. Track more THE RUBY MILLS LTD financial stats to get the full picture.
Yes, RUBYMILLS dividends are paid annually. The last dividend per share was 1.75 INR. As of today, Dividend Yield (TTM)% is 0.80%. Tracking THE RUBY MILLS LTD dividends might help you take more informed decisions.
EBITDA measures a company's operating performance, its growth signifies an improvement in the efficiency of a company. THE RUBY MILLS LTD EBITDA is 454.04 M INR, and current EBITDA margin is 18.71%. See more stats in THE RUBY MILLS LTD financial statements.
Like other stocks, RUBYMILLS shares are traded on stock exchanges, e.g. Nasdaq, Nyse, Euronext, and the easiest way to buy them is through an online stock broker. To do this, you need to open an account and follow a broker's procedures, then start trading. You can trade THE RUBY MILLS LTD stock right from TradingView charts — choose your broker and connect to your account.
Investing in stocks requires a comprehensive research: you should carefully study all the available data, e.g. company's financials, related news, and its technical analysis. So THE RUBY MILLS LTD technincal analysis shows the buy rating today, and its 1 week rating is neutral. Since market conditions are prone to changes, it's worth looking a bit further into the future — according to the 1 month rating THE RUBY MILLS LTD stock shows the neutral signal. See more of THE RUBY MILLS LTD technicals for a more comprehensive analysis.
If you're still not sure, try looking for inspiration in our curated watchlists.
If you're still not sure, try looking for inspiration in our curated watchlists.