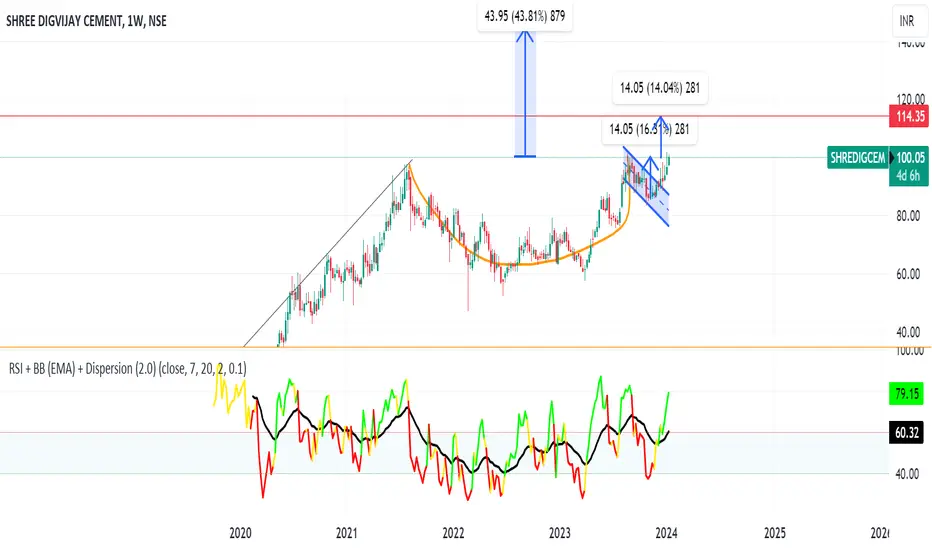
SHREE DIGVIJAY CEMENET AT LONG TERM SUPPORT ZONEThis is the Weekly chart of SHREDIGCEM.
SHREDIGCEM is trading near it's long term support zone at 60-70 range.
stock has been moving within a long-term parallel channel, with a well-established support zone in the range of ₹65–₹70.
Currently, the stock is forming a broadening pattern near its sup
Next report date
—
Report period
—
EPS estimate
—
Revenue estimate
—
1.87 INR
251.88 M INR
7.25 B INR
59.84 M
About SHREE DIGVIJAY CEM CO LTD
Sector
Industry
CEO
Ramanujan Krishna Kumar
Website
Headquarters
Jamnagar
Founded
1944
ISIN
INE232A01011
FIGI
BBG000CZMYH1
Shree Digvijay Cement Co. Ltd. engages in the manufacture and sale of cement. The firm's products include oil well cement, sulphate resisting portland cement, portland pozzolana cement and other varieties of ordinary portland cement. It markets its products under KAMAL brand. The company was founded on November 6, 1944 and is headquartered in Jamnagar, India.
Related stocks

Shree Digvijay CementShree Digvijay Cement, Bullish Entry with SL at Break Of Structure.
RSI has bullish Divergence, Price at good support zone. FII slightly increased its holding

SHREDIGCEM (Swing):SHREDIGCEM (Swing):
This script is well set for am up move for the upcoming days.
Appropriate support, resistance, and target zones are highlighted.
Trade offers a RR of more than 1:7.
Check out my earlier views for a better understanding.
Note: Do your own due diligence before taking any action.

Cup and Hadle pattern (educational purpose only)It seems like stock has formed cup and haddle pattern on daily timeframe. It could give upto 20% upword momentum.
This is strictly for educational purpose only
pleasse do you own analysis.

CUP AND HANDLE PATTERN ON SHREE DIGVIJAY CEMENT
Chart is forming cup and handle formation on weekly chart.
Volume is increasing with the price rise and decreases with fall in price.
FIIs are increasing stake every quarter.
ROCE > 20%, PE < Industry PE
RSI is above 60 , another bullish signal
TARGET -1 : 120
TARGET -2 : 140
STOP LOSS: 8

SHREEDIGICEM - Poised for a 10-15% upmove from cmp.The stock is breaking out of 2 year old consolidation, once can expect 40-50% ROI in short to mid term.
For Swing trade, one may look to enter at current price and trail profits post 114, 14-15% ROI.
The stock is in uptrend in all higher timeframes. The stock is clearly indicating cup and handle p
Clear Breakout
Stock has given breakout, Cup and handdle pattern has been complete and there is an breakout through volume. There is also MACD crossover. Perfect stock for portfolio.

Shri Digvijay Cements Looking really good as it breaks out of the Gann level @104(which is going to be the SL just below this level) with good volumes
Also, weekly candle bounced back from 1/1 levels too.

SHREE DIGVIJAY CEMENT (Swing):SHREE DIGVIJAY CEMENT (Swing):
SDC has broken a major resistance and well set for a 30-40 % up move.
Appropriate demand zone and target is highlighted.
Keep adding between 99-105 with a SL around 92.
Trade offers a RR of more than 1:4.
Note: Do your own due diligence before taking any action.


See all ideas
Summarizing what the indicators are suggesting.
Oscillators
Neutral
SellBuy
Strong sellStrong buy
Strong sellSellNeutralBuyStrong buy
Oscillators
Neutral
SellBuy
Strong sellStrong buy
Strong sellSellNeutralBuyStrong buy
Summary
Neutral
SellBuy
Strong sellStrong buy
Strong sellSellNeutralBuyStrong buy
Summary
Neutral
SellBuy
Strong sellStrong buy
Strong sellSellNeutralBuyStrong buy
Summary
Neutral
SellBuy
Strong sellStrong buy
Strong sellSellNeutralBuyStrong buy
Moving Averages
Neutral
SellBuy
Strong sellStrong buy
Strong sellSellNeutralBuyStrong buy
Moving Averages
Neutral
SellBuy
Strong sellStrong buy
Strong sellSellNeutralBuyStrong buy
Displays a symbol's price movements over previous years to identify recurring trends.
Frequently Asked Questions
The current price of SHREDIGCEM is 82.74 INR — it has decreased by −2.00% in the past 24 hours. Watch SHREE DIGVIJAY CEM CO LTD stock price performance more closely on the chart.
Depending on the exchange, the stock ticker may vary. For instance, on NSE exchange SHREE DIGVIJAY CEM CO LTD stocks are traded under the ticker SHREDIGCEM.
SHREDIGCEM stock has fallen by −2.99% compared to the previous week, the month change is a 2.11% rise, over the last year SHREE DIGVIJAY CEM CO LTD has showed a −18.76% decrease.
SHREDIGCEM reached its all-time high on Jan 19, 2024 with the price of 123.90 INR, and its all-time low was 14.05 INR and was reached on Aug 21, 2019. View more price dynamics on SHREDIGCEM chart.
See other stocks reaching their highest and lowest prices.
See other stocks reaching their highest and lowest prices.
SHREDIGCEM stock is 2.56% volatile and has beta coefficient of 1.05. Track SHREE DIGVIJAY CEM CO LTD stock price on the chart and check out the list of the most volatile stocks — is SHREE DIGVIJAY CEM CO LTD there?
Today SHREE DIGVIJAY CEM CO LTD has the market capitalization of 12.19 B, it has increased by 9.75% over the last week.
Yes, you can track SHREE DIGVIJAY CEM CO LTD financials in yearly and quarterly reports right on TradingView.
SHREE DIGVIJAY CEM CO LTD is going to release the next earnings report on Oct 23, 2025. Keep track of upcoming events with our Earnings Calendar.
SHREDIGCEM net income for the last quarter is 137.87 M INR, while the quarter before that showed 183.57 M INR of net income which accounts for −24.90% change. Track more SHREE DIGVIJAY CEM CO LTD financial stats to get the full picture.
Yes, SHREDIGCEM dividends are paid annually. The last dividend per share was 3.00 INR. As of today, Dividend Yield (TTM)% is 3.64%. Tracking SHREE DIGVIJAY CEM CO LTD dividends might help you take more informed decisions.
SHREE DIGVIJAY CEM CO LTD dividend yield was 2.19% in 2024, and payout ratio reached 87.72%. The year before the numbers were 3.09% and 49.93% correspondingly. See high-dividend stocks and find more opportunities for your portfolio.
EBITDA measures a company's operating performance, its growth signifies an improvement in the efficiency of a company. SHREE DIGVIJAY CEM CO LTD EBITDA is 762.39 M INR, and current EBITDA margin is 7.89%. See more stats in SHREE DIGVIJAY CEM CO LTD financial statements.
Like other stocks, SHREDIGCEM shares are traded on stock exchanges, e.g. Nasdaq, Nyse, Euronext, and the easiest way to buy them is through an online stock broker. To do this, you need to open an account and follow a broker's procedures, then start trading. You can trade SHREE DIGVIJAY CEM CO LTD stock right from TradingView charts — choose your broker and connect to your account.
Investing in stocks requires a comprehensive research: you should carefully study all the available data, e.g. company's financials, related news, and its technical analysis. So SHREE DIGVIJAY CEM CO LTD technincal analysis shows the neutral today, and its 1 week rating is buy. Since market conditions are prone to changes, it's worth looking a bit further into the future — according to the 1 month rating SHREE DIGVIJAY CEM CO LTD stock shows the neutral signal. See more of SHREE DIGVIJAY CEM CO LTD technicals for a more comprehensive analysis.
If you're still not sure, try looking for inspiration in our curated watchlists.
If you're still not sure, try looking for inspiration in our curated watchlists.