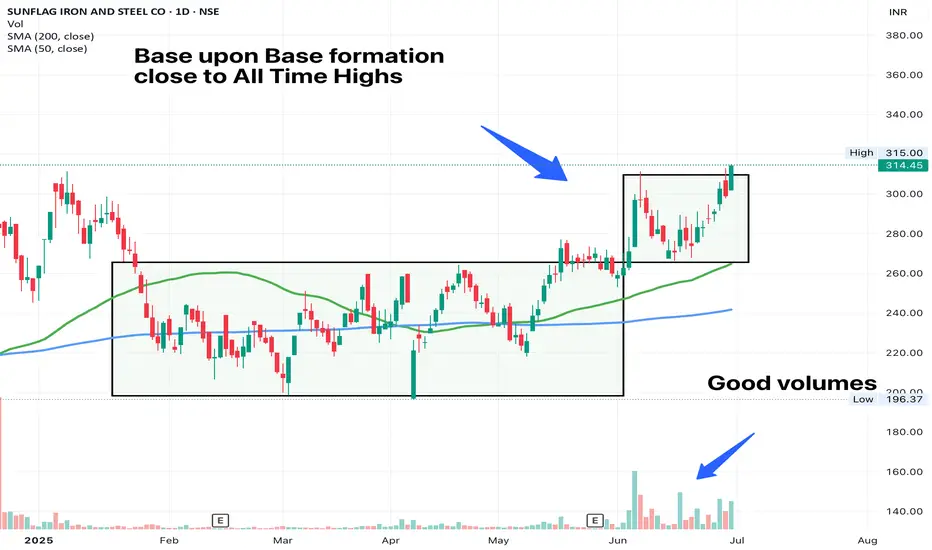
SUNFLAG - Base on Base FormationAnother set-up in the metals space. After Welcorp, LloydSME and APLApollo, this could be another favourable trade. The stock is attempting to breakout of the base today. Volumes have been good and the trend is already in place. Our job as a trader is to sit tight on structures till the trend lasts.
9.00 INR
1.62 B INR
35.36 B INR
39.55 M
About SUNFLAG IRON AND STEEL CO
Sector
Industry
CEO
Brijendra Kumar Tiwari
Website
Headquarters
Nagpur
ISIN
INE947A01014
FIGI
BBG000D0KQ77
Sunflag Iron & Steel Co. Ltd. is a holding company, which engages in the manufacture and trade of iron and steel products. Its products include forging quality steel, forging quality ingots, spring steel, free and semi free cutting steel, micro alloyed steel, bearing steel, cold forging quality steel, engine valve steel, stainless steel rebar, stainless steel, super alloys, and tool steels. The company was founded by Satyadev Bhardwaj on September 12, 1984 and is headquartered in Nagpur, India.
Related stocks
SUNFLAGNSE:SUNFLAG
Note :
1. One should go long with a Stop Loss, below the Trendline or the Previous Swing Low.
2. Risk :Reward ratio should be minimum 1:2.
3. Plan your trade as per the Money Mangement and Risk Appetite.
Disclamier : You are responsible for your profits and loss.
The idea shared he

SUNFLAG IRON AND STEEL CO. S/RSupport and Resistance Levels:
Support Levels: These are price points (green line/shade) where a downward trend may be halted due to a concentration of buying interest. Imagine them as a safety net where buyers step in, preventing further decline.
Resistance Levels: Conversely, resistance levels (re

Can Hold For 3 month This Stock is Extremely in Uptrend.
It is Again given break out so Can Take it .

Sunflag iron & steel trading ideaStock breakout its pennant pattern on the weekly chart also showing a gap up opening on the day chart with very good trade volume although i have created a blog on this stock yesterday but forgot to to post here. now you can see the chart level as i draw
if i talk about the technical part so clearl

SUNFLAG TRIANGLE BREAKOUT
After consolidating for nearly a year, Sunflag has recently broken out of a triangle pattern with an average-sized candle. A strong weekly close would be a positive signal to consider entering the trade, with a recommended stop loss set between 10-12% below the entry point.

SUNFLAG IRON & STE SWING TRADE IDEASUNFLAG IRON & STE looking gud for swing trade as per price action very much near to break its weekly resistance zone few days ago broke inverted head and shoulders chart patterns neck line with gud volume and retested that neck line can look for swing as per your prefered RR.

SunflagLooks very good once the candle closes above 208 where it retested the long term trendline after it broke out a couple of months ago
Chart structure looks good in almost all the time frames
SL below 200

SUNFLAGThese are swing ideas which you can add your watchlist and analysis for yourself !
Keep on your radar!
This content only education purpose!
❗I am not sebi ragister❗

Low risk entryFollow mark level
Breakout trading implementation:
1. **Identifying New Trends:** Breakout trading helps traders identify the beginning of new trends by focusing on price levels where an asset breaks out of its historical trading range.
2. **Volatility Indicator:** Breakouts often occur when ther

See all ideas
Summarizing what the indicators are suggesting.
Oscillators
Neutral
SellBuy
Strong sellStrong buy
Strong sellSellNeutralBuyStrong buy
Oscillators
Neutral
SellBuy
Strong sellStrong buy
Strong sellSellNeutralBuyStrong buy
Summary
Neutral
SellBuy
Strong sellStrong buy
Strong sellSellNeutralBuyStrong buy
Summary
Neutral
SellBuy
Strong sellStrong buy
Strong sellSellNeutralBuyStrong buy
Summary
Neutral
SellBuy
Strong sellStrong buy
Strong sellSellNeutralBuyStrong buy
Moving Averages
Neutral
SellBuy
Strong sellStrong buy
Strong sellSellNeutralBuyStrong buy
Moving Averages
Neutral
SellBuy
Strong sellStrong buy
Strong sellSellNeutralBuyStrong buy
Displays a symbol's price movements over previous years to identify recurring trends.
Frequently Asked Questions
The current price of SUNFLAG is 295.50 INR — it has increased by 1.86% in the past 24 hours. Watch SUNFLAG IRON AND STEEL CO stock price performance more closely on the chart.
Depending on the exchange, the stock ticker may vary. For instance, on NSE exchange SUNFLAG IRON AND STEEL CO stocks are traded under the ticker SUNFLAG.
SUNFLAG stock has risen by 5.54% compared to the previous week, the month change is a −4.94% fall, over the last year SUNFLAG IRON AND STEEL CO has showed a 17.66% increase.
SUNFLAG reached its all-time high on Jul 3, 2025 with the price of 322.00 INR, and its all-time low was 7.00 INR and was reached on Oct 31, 2008. View more price dynamics on SUNFLAG chart.
See other stocks reaching their highest and lowest prices.
See other stocks reaching their highest and lowest prices.
SUNFLAG stock is 3.59% volatile and has beta coefficient of 1.60. Track SUNFLAG IRON AND STEEL CO stock price on the chart and check out the list of the most volatile stocks — is SUNFLAG IRON AND STEEL CO there?
Today SUNFLAG IRON AND STEEL CO has the market capitalization of 52.25 B, it has decreased by −3.53% over the last week.
Yes, you can track SUNFLAG IRON AND STEEL CO financials in yearly and quarterly reports right on TradingView.
SUNFLAG net income for the last quarter is 432.40 M INR, while the quarter before that showed 501.40 M INR of net income which accounts for −13.76% change. Track more SUNFLAG IRON AND STEEL CO financial stats to get the full picture.
SUNFLAG IRON AND STEEL CO dividend yield was 0.00% in 2024, and payout ratio reached 0.00%. The year before the numbers were 0.00% and 0.00% correspondingly. See high-dividend stocks and find more opportunities for your portfolio.
EBITDA measures a company's operating performance, its growth signifies an improvement in the efficiency of a company. SUNFLAG IRON AND STEEL CO EBITDA is 3.89 B INR, and current EBITDA margin is 11.01%. See more stats in SUNFLAG IRON AND STEEL CO financial statements.
Like other stocks, SUNFLAG shares are traded on stock exchanges, e.g. Nasdaq, Nyse, Euronext, and the easiest way to buy them is through an online stock broker. To do this, you need to open an account and follow a broker's procedures, then start trading. You can trade SUNFLAG IRON AND STEEL CO stock right from TradingView charts — choose your broker and connect to your account.
Investing in stocks requires a comprehensive research: you should carefully study all the available data, e.g. company's financials, related news, and its technical analysis. So SUNFLAG IRON AND STEEL CO technincal analysis shows the buy rating today, and its 1 week rating is strong buy. Since market conditions are prone to changes, it's worth looking a bit further into the future — according to the 1 month rating SUNFLAG IRON AND STEEL CO stock shows the buy signal. See more of SUNFLAG IRON AND STEEL CO technicals for a more comprehensive analysis.
If you're still not sure, try looking for inspiration in our curated watchlists.
If you're still not sure, try looking for inspiration in our curated watchlists.