Tata Technologies BuyTata Technologies seems to take support from trend line. Buy @CMP (735) with SL of 698 and target of 785 & 800
Next report date
—
Report period
—
EPS estimate
—
Revenue estimate
—
16.90 INR
6.77 B INR
51.68 B INR
118.20 M
About TATA TECHNOLOGIES LTD
Sector
Industry
CEO
Warren Kevin Harris
Website
Headquarters
Pune
Founded
1989
ISIN
INE142M01025
FIGI
BBG01K52SXB9
Tata Technologies Ltd. is an engineering services company, which engages in the provision of product development and digital solutions, including turnkey solutions, to global original equipment manufacturers (OEMs). It operates through the Service and Technology Solutions segments. The Service segment provides outsourced engineering and designing services and digital transformation services to global manufacturing clients. The Technology Solutions segment refers to the academia upskilling and reskilling solutions and value-added reselling of software applications and solutions. The company was founded by Ratan Naval Tata in 1989 and is headquartered in Pune, India.
Related stocks

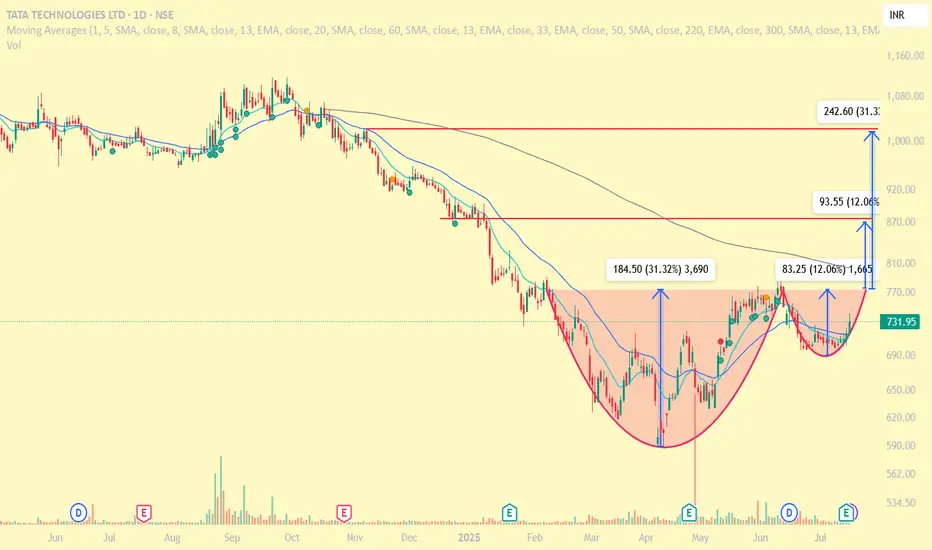
Tatatech: Formation of cup and handlethe chart shows the formation of cup and handle in progress. It may shoot the targets depending upon the market perception.
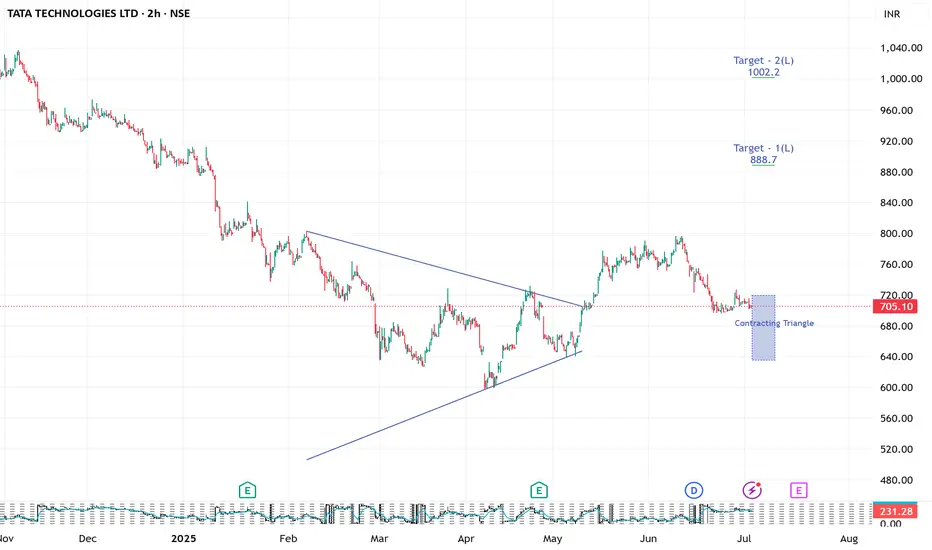
TATA TECHNOLGIES looking strong 2 hrs ( short to medium term
LOOKING stable and strong bullish contracting triangle
pattern suggest us abv 722 closing
price action may show some strength
These classic patterns sometime shows sparkle in price action
pattern may be wrong
do your analysis
this is for educational purpose
TATA TECHHere’s the **professional analysis** of your uploaded **TATA TECHNOLOGIES LTD (TATATECI) weekly chart**, like a seasoned institutional trader:
---
### ✅ **1. Market Structure**
* **Primary Trend:** Strong downtrend from ₹1,300 to ₹597. Now forming a **reversal base**.
* **Current Structure:**

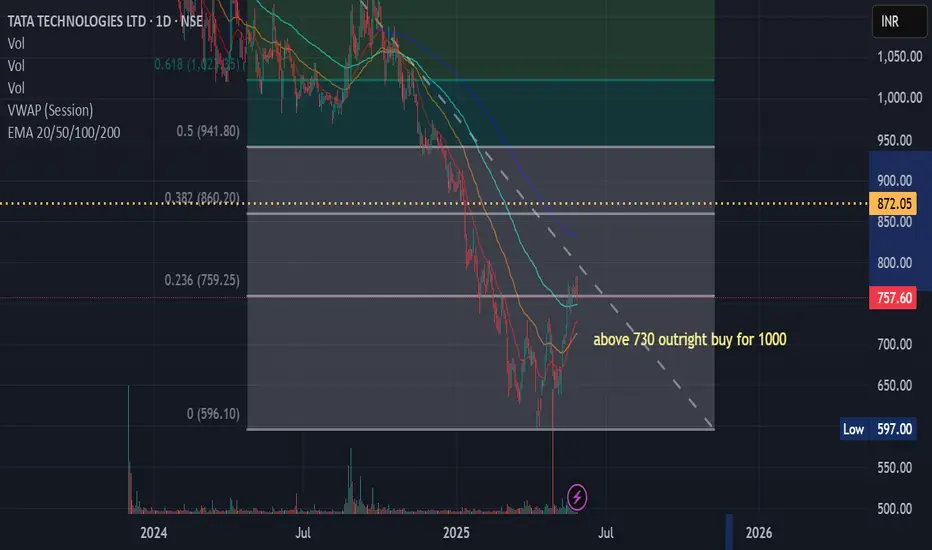
Strenght in nounce back : Tata Tech Strenght in nounce back : Tata Tech
seems like stock is bouncing back from ipo low. forming IPO base
we can expect 20 to 22% target with few months ( o.5 fib retracement marked in chart)
Sl keep trailing.
Its large cap fundamentaly good company
Review and plan for 5th June 2025 Nifty future and banknifty future analysis and intraday plan.
Positional ideas.
This video is for information/education purpose only. you are 100% responsible for any actions you take by reading/viewing this post.
please consult your financial advisor before taking any action.
----Vinaykumar

TATA TECH - Bullish Inverted H&S Breakout (Daily T/F)Trade Setup
📌 Stock: TATA TECHNOLOGIES ( NSE:TATATECH )
📌 Trend: Strong Bullish Momentum
📌 Risk-Reward Ratio: 1:3 (Favorable)
🎯 Entry Zone: ₹750.55(Breakout Confirmation)
🛑 Stop Loss: ₹699.00(Daily Closing Basis) (~5.6% Risk)
🎯 Target Levels:
₹773.45
₹795.70
₹816.35
₹840.55
₹867.00
₹896.85 (Fina


TATATECHKeep eye on TATATECH. If the price moves above 732, consider buying with a small SL.
Confirmation of the head and shoulders pattern occurs when the price breaks decisively below the neckline
Disclaimer:
This is not financial advice. Please do your own research or consult with a financial advisor b

See all ideas
Summarizing what the indicators are suggesting.
Neutral
SellBuy
Strong sellStrong buy
Strong sellSellNeutralBuyStrong buy
Neutral
SellBuy
Strong sellStrong buy
Strong sellSellNeutralBuyStrong buy
Neutral
SellBuy
Strong sellStrong buy
Strong sellSellNeutralBuyStrong buy
An aggregate view of professional's ratings.
Neutral
SellBuy
Strong sellStrong buy
Strong sellSellNeutralBuyStrong buy
Neutral
SellBuy
Strong sellStrong buy
Strong sellSellNeutralBuyStrong buy
Neutral
SellBuy
Strong sellStrong buy
Strong sellSellNeutralBuyStrong buy
Displays a symbol's price movements over previous years to identify recurring trends.
Frequently Asked Questions
The current price of TATATECH is 708.35 INR — it has decreased by −1.36% in the past 24 hours. Watch TATA TECHNOLOGIES LTD stock price performance more closely on the chart.
Depending on the exchange, the stock ticker may vary. For instance, on NSE exchange TATA TECHNOLOGIES LTD stocks are traded under the ticker TATATECH.
TATATECH stock has fallen by −2.70% compared to the previous week, the month change is a 0.76% rise, over the last year TATA TECHNOLOGIES LTD has showed a −28.88% decrease.
We've gathered analysts' opinions on TATA TECHNOLOGIES LTD future price: according to them, TATATECH price has a max estimate of 937.00 INR and a min estimate of 450.00 INR. Watch TATATECH chart and read a more detailed TATA TECHNOLOGIES LTD stock forecast: see what analysts think of TATA TECHNOLOGIES LTD and suggest that you do with its stocks.
TATATECH reached its all-time high on Nov 30, 2023 with the price of 1,400.00 INR, and its all-time low was 597.00 INR and was reached on Apr 7, 2025. View more price dynamics on TATATECH chart.
See other stocks reaching their highest and lowest prices.
See other stocks reaching their highest and lowest prices.
TATATECH stock is 1.75% volatile and has beta coefficient of 1.17. Track TATA TECHNOLOGIES LTD stock price on the chart and check out the list of the most volatile stocks — is TATA TECHNOLOGIES LTD there?
Today TATA TECHNOLOGIES LTD has the market capitalization of 287.17 B, it has increased by 3.74% over the last week.
Yes, you can track TATA TECHNOLOGIES LTD financials in yearly and quarterly reports right on TradingView.
TATA TECHNOLOGIES LTD is going to release the next earnings report on Nov 14, 2025. Keep track of upcoming events with our Earnings Calendar.
TATATECH earnings for the last quarter are 4.20 INR per share, whereas the estimation was 3.79 INR resulting in a 10.76% surprise. The estimated earnings for the next quarter are 4.38 INR per share. See more details about TATA TECHNOLOGIES LTD earnings.
TATA TECHNOLOGIES LTD revenue for the last quarter amounts to 12.44 B INR, despite the estimated figure of 12.15 B INR. In the next quarter, revenue is expected to reach 13.09 B INR.
TATATECH net income for the last quarter is 1.70 B INR, while the quarter before that showed 1.89 B INR of net income which accounts for −9.84% change. Track more TATA TECHNOLOGIES LTD financial stats to get the full picture.
Yes, TATATECH dividends are paid annually. The last dividend per share was 11.70 INR. As of today, Dividend Yield (TTM)% is 1.18%. Tracking TATA TECHNOLOGIES LTD dividends might help you take more informed decisions.
TATA TECHNOLOGIES LTD dividend yield was 1.23% in 2024, and payout ratio reached 50.04%. The year before the numbers were 0.82% and 50.16% correspondingly. See high-dividend stocks and find more opportunities for your portfolio.
As of Jul 27, 2025, the company has 12.64 K employees. See our rating of the largest employees — is TATA TECHNOLOGIES LTD on this list?
EBITDA measures a company's operating performance, its growth signifies an improvement in the efficiency of a company. TATA TECHNOLOGIES LTD EBITDA is 9.03 B INR, and current EBITDA margin is 18.26%. See more stats in TATA TECHNOLOGIES LTD financial statements.
Like other stocks, TATATECH shares are traded on stock exchanges, e.g. Nasdaq, Nyse, Euronext, and the easiest way to buy them is through an online stock broker. To do this, you need to open an account and follow a broker's procedures, then start trading. You can trade TATA TECHNOLOGIES LTD stock right from TradingView charts — choose your broker and connect to your account.
Investing in stocks requires a comprehensive research: you should carefully study all the available data, e.g. company's financials, related news, and its technical analysis. So TATA TECHNOLOGIES LTD technincal analysis shows the sell today, and its 1 week rating is sell. Since market conditions are prone to changes, it's worth looking a bit further into the future — according to the 1 month rating TATA TECHNOLOGIES LTD stock shows the sell signal. See more of TATA TECHNOLOGIES LTD technicals for a more comprehensive analysis.
If you're still not sure, try looking for inspiration in our curated watchlists.
If you're still not sure, try looking for inspiration in our curated watchlists.