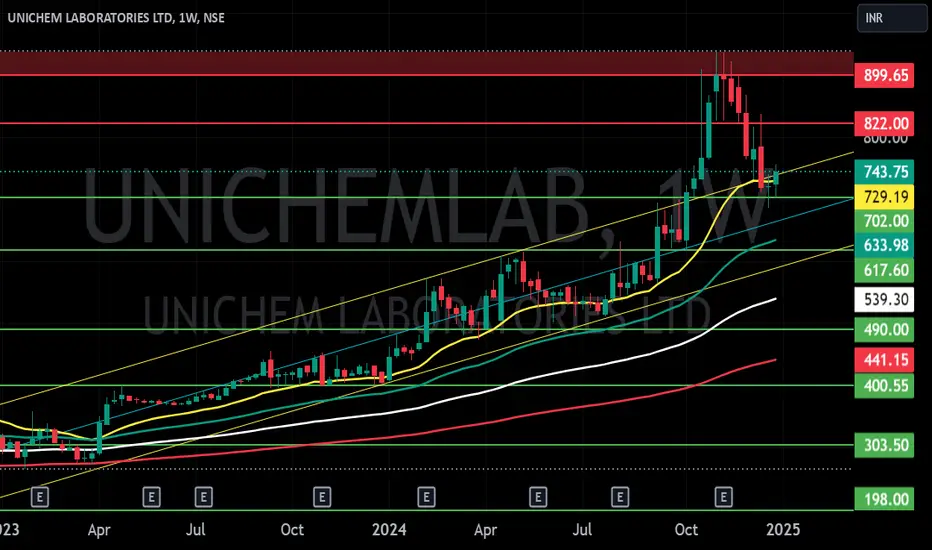
UNICHEM LABORATORIES LTD S/RSupport and Resistance Levels:
Support Levels: These are price points (green line/shade) where a downward trend may be halted due to a concentration of buying interest. Imagine them as a safety net where buyers step in, preventing further decline.
Resistance Levels: Conversely, resistance levels (re
21.40 INR
1.38 B INR
20.81 B INR
20.42 M
About UNICHEM LABORATORIES LTD
Sector
Industry
CEO
P. Kalipada Bhattacharyya
Website
Headquarters
Mumbai
Founded
1944
ISIN
INE351A01035
FIGI
BBG000D1GV60
Unichem Laboratories Ltd. is a pharmaceutical company, which engages in the manufacturing and marketing of pharmaceutical formulations. The firm offers its products that address relevant therapeutic areas like gastroenterology, cardiology, diabetology, psychiatry, neurology, anti-bacterials, anti-infectives, and pain management. It operates through India and Outside India geographical segments. The Outside India segment comprises of United States of America and others. The company was founded by Amrut Mody in 1944 and is headquartered in Mumbai, India.
Related stocks
UNICHEMLABDisclaimer :
This is not financial advice. Please do your own research or consult with a financial advisor before making any investment decisions. Investments in stocks can be risky and may result in loss of capital.

Unichem Laboratories Ltd view for Intraday 18th Nov #UNICHEMLAB Unichem Laboratories Ltd view for Intraday 18th Nov #UNICHEMLAB
Resistance 900. Watching above 902 for upside movement...
Support area 885. Below 890 ignoring upside momentum for intraday
Support 885 Watching below 884 for downside movement...
Resistance area 900
Above 890 ignoring downside move

UNICHEMLAB bought @ 735 in @ 735 (14-oct-2024)
Reason: expecting good results as also price is showing the uptrend, ATH, Strong RSI and volume.
Exit: SL with -8%
Buy more : if stock goes beyond 15%
Always respect your SL


Unichem Labs
Loss making company turning profitable in the last quarter with both promoters ,FII/DIIs increasing their stake
Also, given a long term Gann level breakout
Very good RR WITH SL @ 550

UNICHEMLAB VCP Pattern - Weekly chartUnichem Laboratories Ltd
NSE: UNICHEMLAB
A long VCP pattern is about to play in UNICHEMLAB.
Prior Breakout gave a sharp sell off which was absorbed and gave a decent immediate upmove with high volumes.
Contraction at the juncture; a strong close above 400 is a good buy with 270 as Stop and 680 as


buy unichemunichemlab has retest it breakout level. we may stock can rise till 360 till the time it holds 293 clbs

Unichem breakout buy unichemlab
sector pharma
sector- bullish yes
consolidation- done 5 months
breakout - done yes
200 ema-rising 30
RS - strong yes
volume- heavy c
bo level 273
buy level 275
buy date 6.10.20
bo day close 273

See all ideas
Summarizing what the indicators are suggesting.
Oscillators
Neutral
SellBuy
Strong sellStrong buy
Strong sellSellNeutralBuyStrong buy
Oscillators
Neutral
SellBuy
Strong sellStrong buy
Strong sellSellNeutralBuyStrong buy
Summary
Neutral
SellBuy
Strong sellStrong buy
Strong sellSellNeutralBuyStrong buy
Summary
Neutral
SellBuy
Strong sellStrong buy
Strong sellSellNeutralBuyStrong buy
Summary
Neutral
SellBuy
Strong sellStrong buy
Strong sellSellNeutralBuyStrong buy
Moving Averages
Neutral
SellBuy
Strong sellStrong buy
Strong sellSellNeutralBuyStrong buy
Moving Averages
Neutral
SellBuy
Strong sellStrong buy
Strong sellSellNeutralBuyStrong buy
Displays a symbol's price movements over previous years to identify recurring trends.
Frequently Asked Questions
The current price of UNICHEMLAB is 634.10 INR — it has increased by 0.06% in the past 24 hours. Watch UNICHEM LABORATORIES LTD stock price performance more closely on the chart.
Depending on the exchange, the stock ticker may vary. For instance, on NSE exchange UNICHEM LABORATORIES LTD stocks are traded under the ticker UNICHEMLAB.
UNICHEMLAB stock has risen by 0.46% compared to the previous week, the month change is a 7.30% rise, over the last year UNICHEM LABORATORIES LTD has showed a 17.23% increase.
UNICHEMLAB reached its all-time high on Nov 8, 2024 with the price of 937.95 INR, and its all-time low was 3.85 INR and was reached on Feb 10, 1998. View more price dynamics on UNICHEMLAB chart.
See other stocks reaching their highest and lowest prices.
See other stocks reaching their highest and lowest prices.
UNICHEMLAB stock is 3.19% volatile and has beta coefficient of 1.16. Track UNICHEM LABORATORIES LTD stock price on the chart and check out the list of the most volatile stocks — is UNICHEM LABORATORIES LTD there?
Today UNICHEM LABORATORIES LTD has the market capitalization of 44.55 B, it has increased by 8.00% over the last week.
Yes, you can track UNICHEM LABORATORIES LTD financials in yearly and quarterly reports right on TradingView.
UNICHEMLAB net income for the last quarter is 529.70 M INR, while the quarter before that showed 578.50 M INR of net income which accounts for −8.44% change. Track more UNICHEM LABORATORIES LTD financial stats to get the full picture.
As of Jul 27, 2025, the company has 3.33 K employees. See our rating of the largest employees — is UNICHEM LABORATORIES LTD on this list?
EBITDA measures a company's operating performance, its growth signifies an improvement in the efficiency of a company. UNICHEM LABORATORIES LTD EBITDA is 2.70 B INR, and current EBITDA margin is 11.27%. See more stats in UNICHEM LABORATORIES LTD financial statements.
Like other stocks, UNICHEMLAB shares are traded on stock exchanges, e.g. Nasdaq, Nyse, Euronext, and the easiest way to buy them is through an online stock broker. To do this, you need to open an account and follow a broker's procedures, then start trading. You can trade UNICHEM LABORATORIES LTD stock right from TradingView charts — choose your broker and connect to your account.
Investing in stocks requires a comprehensive research: you should carefully study all the available data, e.g. company's financials, related news, and its technical analysis. So UNICHEM LABORATORIES LTD technincal analysis shows the buy rating today, and its 1 week rating is buy. Since market conditions are prone to changes, it's worth looking a bit further into the future — according to the 1 month rating UNICHEM LABORATORIES LTD stock shows the buy signal. See more of UNICHEM LABORATORIES LTD technicals for a more comprehensive analysis.
If you're still not sure, try looking for inspiration in our curated watchlists.
If you're still not sure, try looking for inspiration in our curated watchlists.