Venky-Nice BreakoutVenky-Nice Breakout
Capital to be deployed -20k
Investing Price-2443
Breakout Price -2443
Stoploss -2197
Targets -3178-3343
#gujrat #maharastra #StockMarketindia #StockToWatch #StocksInFocus #stockstowatch #StocksToTrade
#venky
Next report date
—
Report period
—
EPS estimate
—
Revenue estimate
—
82.80 INR
1.17 B INR
33.07 B INR
4.58 M
About VENKY S (INDIA) LTD
Sector
Industry
CEO
Balaji Rao Banda
Website
Headquarters
Pune
Founded
1976
ISIN
INE398A01010
FIGI
BBG000D25FJ1
Venky's India Ltd. engages in the production and sale of poultry products. It operates through the following segments: Poultry & Poultry Products, Animal Health Products, and Oilseed. The Poultry & Poultry Products segment produces and sells chicks, grownup commercial broiler and layer, processed chicken, specific pathogen free eggs, poultry feed and other miscellaneous poultry products. The Animal Health Products segment offers medicines and other health products for birds. The Oilseed segment provides edible refined soya oil and soya de-oiled cake. The company was founded in 1976 and is headquartered in Pune, India.
Related stocks

A Double Bottom for VENKEY's?!?!?!A visible double bottom!
Stock seems consolidation done!
Long in it!

VENKEYSVENKEYS: Gaped out of 1 year base with good volume
Consolidating near gap region
Last 2 Qtr earnings decent
FII holding slightly increased
Low float stock
As of now outperforming #CNX500

Venky's still have downside?I am looking it at the Monthly level - you can see the price inside the Big Triangle.
Currently price is completing the second leg of the Triangle zig-zag.
If my assumption is right, there is still room for 30-35% downside, until it hits the lower wall of the Triangle.
Venky's being one of the

VENKYS Count your chickens before they are hatched ..BUYGood inverted head and shoulders...breakout....this chicken stock..should shoot up fast ..tgt of pattern calculated and posted on chart...

Comprehensive Analysis of VENKEYS (NSE: VENKEYS)Technical Overview:
1. Doji on Rising Trendline:
The weekly chart for VENKEYS reveals a Doji candlestick pattern occurring at a rising trendline. A Doji signals market indecision and potential trend reversal. In the context of a rising trendline, it suggests a point of equilibrium between buyer


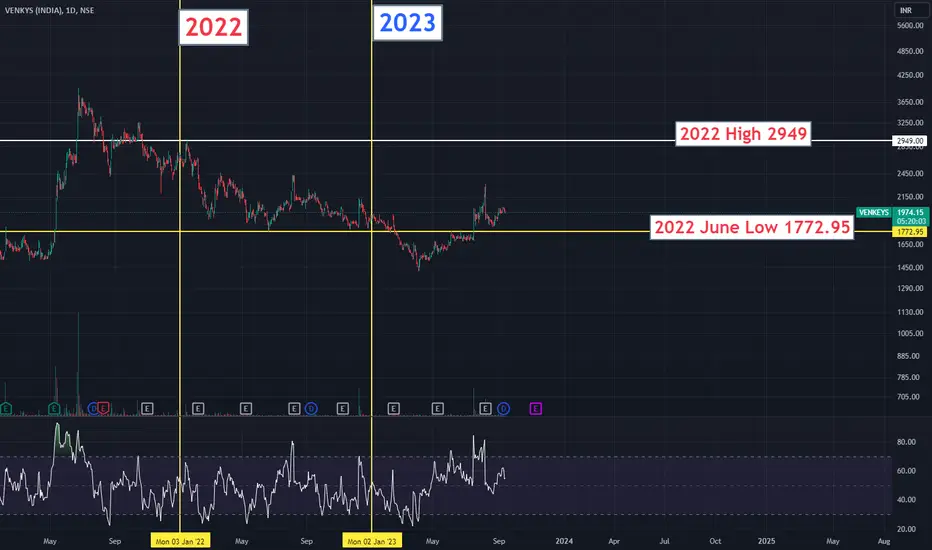
VENKYVenky is finding support ah the 2022 June Low Price level...if this Price level Sustain...we may see more upside

Resistance BreakoutPlease look into the chart for a detailed understanding.
Consider these for short-term & swing trades with 2% profit.
For BTST trades consider booking
target for 1% - 2%
For long-term trades look out for resistance drawn above closing.
Please consider these ideas for educational purpose

See all ideas
Summarizing what the indicators are suggesting.
Oscillators
Neutral
SellBuy
Strong sellStrong buy
Strong sellSellNeutralBuyStrong buy
Oscillators
Neutral
SellBuy
Strong sellStrong buy
Strong sellSellNeutralBuyStrong buy
Summary
Neutral
SellBuy
Strong sellStrong buy
Strong sellSellNeutralBuyStrong buy
Summary
Neutral
SellBuy
Strong sellStrong buy
Strong sellSellNeutralBuyStrong buy
Summary
Neutral
SellBuy
Strong sellStrong buy
Strong sellSellNeutralBuyStrong buy
Moving Averages
Neutral
SellBuy
Strong sellStrong buy
Strong sellSellNeutralBuyStrong buy
Moving Averages
Neutral
SellBuy
Strong sellStrong buy
Strong sellSellNeutralBuyStrong buy
Displays a symbol's price movements over previous years to identify recurring trends.
Frequently Asked Questions
The current price of VENKEYS is 1,500.40 INR — it has decreased by −0.50% in the past 24 hours. Watch VENKY S (INDIA) LTD stock price performance more closely on the chart.
Depending on the exchange, the stock ticker may vary. For instance, on NSE exchange VENKY S (INDIA) LTD stocks are traded under the ticker VENKEYS.
VENKEYS stock has fallen by −3.21% compared to the previous week, the month change is a −6.58% fall, over the last year VENKY S (INDIA) LTD has showed a −24.68% decrease.
VENKEYS reached its all-time high on Apr 9, 2018 with the price of 4,725.00 INR, and its all-time low was 32.85 INR and was reached on Jul 27, 2004. View more price dynamics on VENKEYS chart.
See other stocks reaching their highest and lowest prices.
See other stocks reaching their highest and lowest prices.
VENKEYS stock is 1.53% volatile and has beta coefficient of 0.49. Track VENKY S (INDIA) LTD stock price on the chart and check out the list of the most volatile stocks — is VENKY S (INDIA) LTD there?
Today VENKY S (INDIA) LTD has the market capitalization of 21.19 B, it has decreased by −0.89% over the last week.
Yes, you can track VENKY S (INDIA) LTD financials in yearly and quarterly reports right on TradingView.
VENKY S (INDIA) LTD is going to release the next earnings report on Aug 8, 2025. Keep track of upcoming events with our Earnings Calendar.
VENKEYS net income for the last quarter is 133.00 M INR, while the quarter before that showed 203.80 M INR of net income which accounts for −34.74% change. Track more VENKY S (INDIA) LTD financial stats to get the full picture.
Yes, VENKEYS dividends are paid annually. The last dividend per share was 7.00 INR. As of today, Dividend Yield (TTM)% is 0.47%. Tracking VENKY S (INDIA) LTD dividends might help you take more informed decisions.
EBITDA measures a company's operating performance, its growth signifies an improvement in the efficiency of a company. VENKY S (INDIA) LTD EBITDA is 1.72 B INR, and current EBITDA margin is 5.19%. See more stats in VENKY S (INDIA) LTD financial statements.
Like other stocks, VENKEYS shares are traded on stock exchanges, e.g. Nasdaq, Nyse, Euronext, and the easiest way to buy them is through an online stock broker. To do this, you need to open an account and follow a broker's procedures, then start trading. You can trade VENKY S (INDIA) LTD stock right from TradingView charts — choose your broker and connect to your account.
Investing in stocks requires a comprehensive research: you should carefully study all the available data, e.g. company's financials, related news, and its technical analysis. So VENKY S (INDIA) LTD technincal analysis shows the sell today, and its 1 week rating is strong sell. Since market conditions are prone to changes, it's worth looking a bit further into the future — according to the 1 month rating VENKY S (INDIA) LTD stock shows the sell signal. See more of VENKY S (INDIA) LTD technicals for a more comprehensive analysis.
If you're still not sure, try looking for inspiration in our curated watchlists.
If you're still not sure, try looking for inspiration in our curated watchlists.