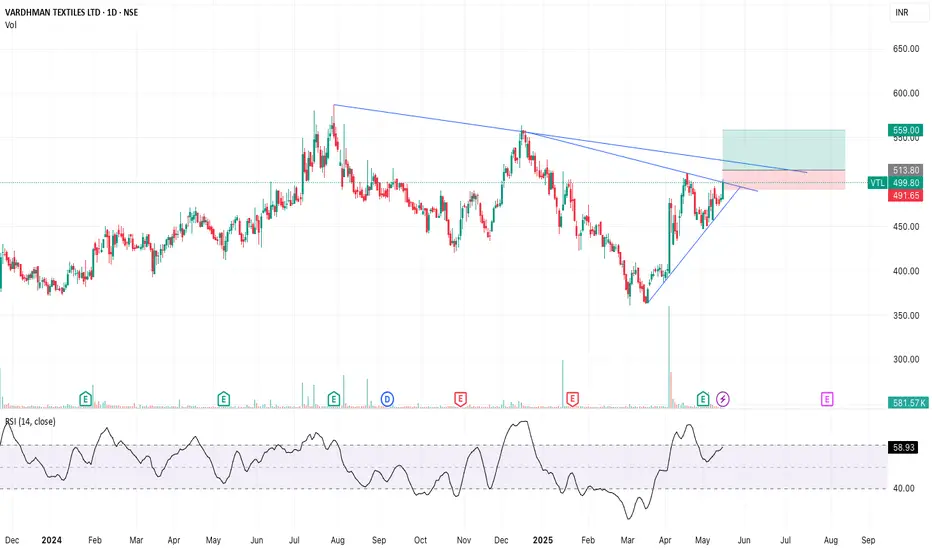
VTL In Strong uptrend for until it holds the Yellow Uptrend line. Odd chance it can break down on worst case on red down trend channel.
Next report date
—
Report period
—
EPS estimate
—
Revenue estimate
—
30.90 INR
8.83 B INR
97.85 B INR
102.73 M
About VARDHMAN TEXTILES LTD
Sector
Industry
Website
Headquarters
Ludhiana
Founded
1965
ISIN
INE825A01020
FIGI
BBG000CW10M9
Vardhman Textiles Ltd. engages in the manufacture, purchase, and sale of textiles. Its products includes cotton yarn, synthetic yarn, woven fabric, sewing thread and acrylic fiber. The company was founded by Lala Rattan Chand Oswal in 1965 and is headquartered in Ludhiana, India.

VLT LongMACD, Triple MA, RSI and Volume are aligning with the long trade
Fundamentals look good too.
enter only after recent swing high BoS.
50 SMA Rising- Positional TradeDisclaimer: I am not a Sebi registered adviser.
This Idea is publish purely for educational purpose only before investing in any stocks please take advise from your financial adviser.
Its 50 SMA Rising Strategy. Suitable for Positional Trading Initial Stop loss lowest of last 2 candles and keep tra

VTL buy Charts for Educational purposes only.
Please follow strict stop loss and risk reward if you follow the level.
Thanks,

Vardhman Textiles: On the Verge of a Major Breakout! Vardhman Textiles: On the Verge of a Major Breakout!
Current Market Price: ₹554
Stop Loss: ₹420
Targets: ₹902 | ₹942
Key Highlights:
3-Year Rounding Bottom Formation: Vardhman Textiles is nearing a significant breakout level of ₹576, completing a large 3-year rounding bottom pattern.
Breakout D

VTL S/R Support and Resistance Levels:
Support Levels: These are price points (green line/shade) where a downward trend may be halted due to a concentration of buying interest. Imagine them as a safety net where buyers step in, preventing further decline.
Resistance Levels: Conversely, resistance levels (re


Upward Moving Channel Breakout - VTL📊 Script: VTL
📊 Sector: Textiles
📊 Industry: Textiles - Cotton/Blended
Key highlights: 💡⚡
📈 Script is giving Breakout of Upward Moving Channel on daily chart.
📈 Keep an eye on stock we may see some good rally.
📈 One can go for Swing Trade.
⏱️ C.M.P 📑💰- 535
🟢 Target 🎯🏆 - 572
⚠️ Stoploss ☠️🚫 - 520

VTL BO after a year long consolidation. wait for retest and do your own analysis before entering any trade. Boost the post if you like the post. Thank you

Focus on vardhman textile Ltd. Vardhman textile Ltd 2nd attempt to reach 550 Mark. Now VTL in a break out zone.

See all ideas
Summarizing what the indicators are suggesting.
Neutral
SellBuy
Strong sellStrong buy
Strong sellSellNeutralBuyStrong buy
Neutral
SellBuy
Strong sellStrong buy
Strong sellSellNeutralBuyStrong buy
Neutral
SellBuy
Strong sellStrong buy
Strong sellSellNeutralBuyStrong buy
An aggregate view of professional's ratings.
Neutral
SellBuy
Strong sellStrong buy
Strong sellSellNeutralBuyStrong buy
Neutral
SellBuy
Strong sellStrong buy
Strong sellSellNeutralBuyStrong buy
Neutral
SellBuy
Strong sellStrong buy
Strong sellSellNeutralBuyStrong buy
Displays a symbol's price movements over previous years to identify recurring trends.
Related stocks
Frequently Asked Questions
The current price of VTL is 482.15 INR — it has decreased by −1.71% in the past 24 hours. Watch VARDHMAN TEXTILES LTD stock price performance more closely on the chart.
Depending on the exchange, the stock ticker may vary. For instance, on NSE exchange VARDHMAN TEXTILES LTD stocks are traded under the ticker VTL.
VTL stock has fallen by −1.21% compared to the previous week, the month change is a 0.47% rise, over the last year VARDHMAN TEXTILES LTD has showed a 1.20% increase.
We've gathered analysts' opinions on VARDHMAN TEXTILES LTD future price: according to them, VTL price has a max estimate of 553.00 INR and a min estimate of 394.00 INR. Watch VTL chart and read a more detailed VARDHMAN TEXTILES LTD stock forecast: see what analysts think of VARDHMAN TEXTILES LTD and suggest that you do with its stocks.
VTL stock is 3.06% volatile and has beta coefficient of 1.04. Track VARDHMAN TEXTILES LTD stock price on the chart and check out the list of the most volatile stocks — is VARDHMAN TEXTILES LTD there?
Today VARDHMAN TEXTILES LTD has the market capitalization of 139.45 B, it has decreased by −1.06% over the last week.
Yes, you can track VARDHMAN TEXTILES LTD financials in yearly and quarterly reports right on TradingView.
VARDHMAN TEXTILES LTD is going to release the next earnings report on Jul 30, 2025. Keep track of upcoming events with our Earnings Calendar.
VTL net income for the last quarter is 2.37 B INR, while the quarter before that showed 2.11 B INR of net income which accounts for 12.68% change. Track more VARDHMAN TEXTILES LTD financial stats to get the full picture.
Yes, VTL dividends are paid annually. The last dividend per share was 4.00 INR. As of today, Dividend Yield (TTM)% is 0.83%. Tracking VARDHMAN TEXTILES LTD dividends might help you take more informed decisions.
EBITDA measures a company's operating performance, its growth signifies an improvement in the efficiency of a company. VARDHMAN TEXTILES LTD EBITDA is 12.63 B INR, and current EBITDA margin is 12.91%. See more stats in VARDHMAN TEXTILES LTD financial statements.
Like other stocks, VTL shares are traded on stock exchanges, e.g. Nasdaq, Nyse, Euronext, and the easiest way to buy them is through an online stock broker. To do this, you need to open an account and follow a broker's procedures, then start trading. You can trade VARDHMAN TEXTILES LTD stock right from TradingView charts — choose your broker and connect to your account.
Investing in stocks requires a comprehensive research: you should carefully study all the available data, e.g. company's financials, related news, and its technical analysis. So VARDHMAN TEXTILES LTD technincal analysis shows the sell today, and its 1 week rating is buy. Since market conditions are prone to changes, it's worth looking a bit further into the future — according to the 1 month rating VARDHMAN TEXTILES LTD stock shows the strong buy signal. See more of VARDHMAN TEXTILES LTD technicals for a more comprehensive analysis.
If you're still not sure, try looking for inspiration in our curated watchlists.
If you're still not sure, try looking for inspiration in our curated watchlists.