CC LongCC1! is now net long on the regression break.
The roll on this pair long is +9%.
I am considering this trade.
CJZ2026 trade ideas

Cocoa long opportunityPossible long opportunity on cocoa as the price seems to be finding support at a weekly demand level.
A breach above the latest week's high is what i am looking for to enter longs
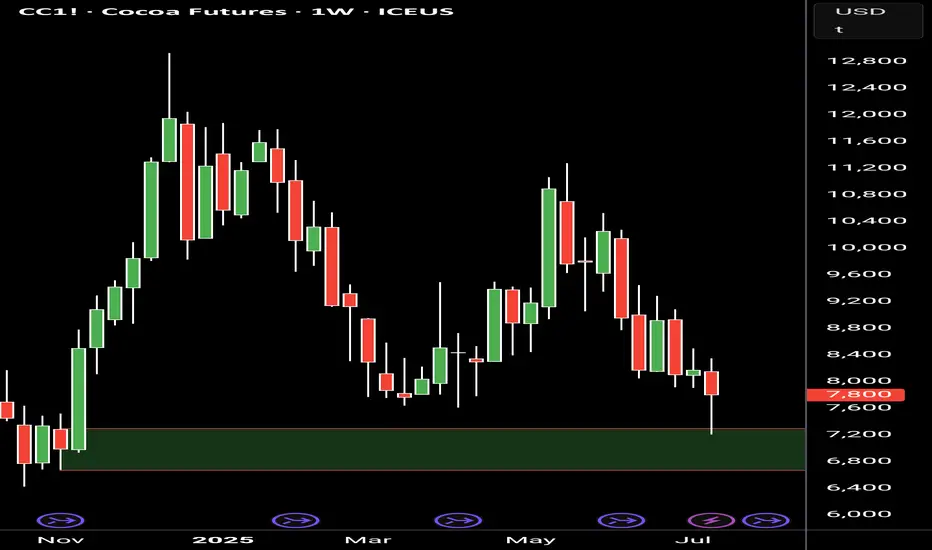
Cocoa Futures: CC1! Potential Pullback at Familiar Supply ZoneCocoa futures (CC1) are approaching a key demand zone previously tested in March 2025. This area, highlighted on the chart, presents a potential for a pullback, fueled by likely buy orders from commercial traders, as indicated by bullish sentiment evident in the latest Commitment of Traders (COT) report. We're watching for a reversal pattern within these highlighted zones, signaling a shift from the current upward trend. This anticipated pullback, driven by commercial market participation, could offer a compelling entry point for traders looking to capitalize on a potential reversal in the agricultural commodity.
✅ Please share your thoughts about CC1! in the comments section below and HIT LIKE if you appreciate my analysis. Don't forget to FOLLOW ME; you will help us a lot with this small contribution.

Cocoa $CC Evidence leans toward a bearish scenario due to the breakout below 9,200 and seasonal weakness in summer months. However, traders should remain open to bullish reversals, especially if institutional buying continues, and consider range-bound strategies if volatility stabilizes. Monitoring fundamental factors like weather in cocoa-producing regions and global demand trends will be crucial for a comprehensive strategy.

Cocoa Bounce From Demand – Can This Lead to a New 2025 High?On June 11th, price reacted sharply to a key demand block around the 8,880–9,000 zone, which aligns with:
Golden Pocket Fib (0.705–0.78) between 8,420 and 9,006
The midpoint of a previous consolidation range
A liquidity sweep followed by a strong bullish rejection
The RSI is showing a bullish divergence (lower lows on price vs rising RSI), which supports a possible technical rebound.
🟣 Immediate target: 10,400–10,600 (supply zone)
🔴 The bullish bias would be invalidated on a close below 8,850
📈 Commitments of Traders (COT) – as of June 3, 2025
Non-Commercials (speculators): still net long, but reduced their long exposure by -2,006 contracts, and trimmed shorts slightly as well
Commercials: remain heavily net short with over 61,000 contracts (61.4% of OI), indicating ongoing hedging by producers
Open Interest dropped by -1,257 → a sign of general position liquidation
➡️ The reduction in speculative longs likely reflects profit-taking after the May rally, but overall net positioning remains bullish on a medium-term view.
📅 Seasonality – June
On the 20, 15 and 10-year averages, June typically shows a moderately bullish rebound, often following weakness in May.
On the 5 and 2-year views, however, performance is more neutral to slightly negative.
Historically, June acts as a consolidation or pre-rally month, often preceding a stronger uptrend in July–August.
🧠 Operational Outlook
Bias: Moderately bullish in the short term, with potential recovery toward 10,400. Structure still shows signs of broader distribution, so caution remains in the medium term.
🎯 Trade idea:
Aggressive long initiated on the bounce from demand
First target: 10,400
Breakout extension: 11,200
Invalidation on daily close below 8,850

BULLISH CACOA Bullish on Cacoa with target at $13000. we may break this higher resistance with the durrent supply sortage on the market.

Cocoa Explosion Loading? Specs & Hedgers Agree🔍 Fundamental Analysis – Commitment of Traders (COT)
The latest COT report, dated May 13, 2025, reveals a strong bullish accumulation signal, with a significant increase in long positions across all major trader categories.
Specifically, Non-Commercials (speculative traders such as hedge funds and money managers) increased their long positions by +3,490 contracts while simultaneously reducing shorts by -467 contracts. This dynamic reflects renewed speculative confidence in the cocoa bullish trend.
Simultaneously, Commercials (typically producers and processors) added +5,187 long contracts and closed -661 short contracts. This is especially noteworthy, as commercials usually take the opposite side of speculators. Here, however, their alignment with speculators may indicate expectations of upcoming supply constraints or market stress.
Total open interest rose by more than +6,000 contracts, suggesting real capital inflow into the market rather than just rebalancing.
This alignment between speculators and institutional hedgers is rare and often precedes further price appreciation.
📈 Net Positions & Price Action
Looking at the “Net Positions & Prices” chart over the past year, it’s clear that Non-Commercial net positions are recovering after a notable drop in March and April. This reversal aligns with the technical bottom and the start of the current price rally.
Commercials, although still net short (in line with their historical bias), are reducing their bearish exposure, hinting at lower physical supply pressure or a need for hedging against further price increases.
Price action has reflected this narrative, surging higher following the April lows.
🕰️ Seasonal Analysis
Seasonality adds another layer to the analysis.
Historically, May tends to be flat or slightly bearish (10Y and 15Y averages), but the 2-Year seasonal line—which better reflects current market behavior—shows a strong bullish tendency starting mid-month. This supports the ongoing rebound and increases the likelihood of further upside in the short term.
Historical data also shows that June, while volatile, is often positive or neutral in shorter cycles.
📊 Technical Analysis
From a technical perspective, cocoa recently completed a strong bullish leg, rebounding from the 8,800–9,000 USD demand zone, identified as a clear area of institutional buying (evident through volume and impulsive candles).
The price then decisively broke through mid-range resistance levels and tested a key weekly supply zone between 11,200 and 11,500 USD, where it was initially rejected.
Currently, we are in a technical pullback, likely targeting the mitigation zone at 9,700–10,000 USD. This area represents a solid long entry opportunity if the market confirms a bullish structure on intraday charts (H1 or H4).
The RSI is near overbought, yet without divergence—suggesting the trend remains structurally bullish despite a natural correction.
🧭 Strategic Conclusion
Cocoa currently shows a rare convergence of bullish signals: supportive COT positioning, increasing net long interest, strong 2Y seasonality, and clear technical structure controlled by buyers.
However, after the recent sharp upside move, a correction to key support zones is likely before another bullish leg unfolds.

Cocoa's Future: Sweet Commodity or Bitter Harvest?The global cocoa market faces significant turbulence, driven by a complex interplay of environmental, political, and economic factors threatening price stability and future supply. Climate change presents a major challenge, with unpredictable weather patterns in West Africa increasing disease risk and directly impacting yields, as evidenced by farmer reports and scientific studies showing significant yield reductions due to higher temperatures. Farmers warn of potential crop destruction within the decade without substantial support and adaptation measures.
Geopolitical pressures add another layer of complexity, particularly regarding farmgate pricing in Ghana and Côte d'Ivoire. Political debate in Ghana centres on demands to double farmer payments to align with campaign promises and counter the incentive for cross-border smuggling created by higher prices in neighbouring Côte d'Ivoire. This disparity highlights the precarious economic situation for many farmers and the national security implications of unprofitable cocoa cultivation.
Supply chain vulnerabilities, including aging trees, disease prevalence like Swollen Shoot Virus, and historical underinvestment by farmers due to low prices, contribute to a significant gap between potential and actual yields. While recent projections suggest a potential surplus for 2024/25 after a record deficit, pollination limitations remain a key constraint, with studies confirming yields are often capped by insufficient natural pollination. Concurrently, high prices are dampening consumer demand and forcing manufacturers to consider reformulating products, reflected in declining cocoa grinding figures globally.
Addressing these challenges necessitates a multi-pronged approach focused on sustainability and resilience. Initiatives promoting fairer farmer compensation, longer-term contracts, agroforestry practices, and improved soil management are crucial. Enhanced collaboration across the value chain, alongside government support for sustainable practices and compliance with new environmental regulations, is essential to navigate the current volatility and secure a stable future for cocoa production and the millions who depend on it.

Cocoa futures swing idea There is some room for price to advance to 9.500 area for a nice swing. We'll see.

LONG FUTURE CACAO Hello everyone, today I’m sharing my analysis on cocoa futures, as I see an interesting opportunity for an upward move. Below, I’ll break down the reasons behind my bullish bias and my entry strategy. Let’s get into the details!
Why I’m Bullish on Cocoa Futures
Institutional and Retail Activity
My indicator is showing an incredible amount of long contracts from institutional players, while retail traders are selling aggressively, which is a bit alarming. Since retail traders often get it wrong, this strengthens my expectation of an upcoming upward move, and I’m looking for a long entry.
Open Interest
My open interest indicator confirms my bias, as all open positions are longs. This signals strong buying interest from the big market players, aligning with my bullish outlook.
Valuation
My valuation indicator also shows a clear undervaluation of cocoa, suggesting that the current price is an attractive opportunity for buyers.
Technical Analysis
The price recently touched a key zone on the weekly timeframe, and in that touch and reaction, it left a zone that, based on my objective parameters, is actionable, as cocoa is at a significantly discounted price. While this move and reaction might not yet change the downtrend on lower timeframes, I can take advantage of this zone for a tactical entry. Let’s recall the principle of supply and demand: I’m placing my entries where institutions have their buy orders, and this is one of those zones.
Additionally, on higher timeframes, I see very significant demand zones below, which suggests a potential upward move that could indeed shift the trend to bullish. However, for this specific entry, I’m aiming for an entry within the next day. If the price drops further, I’ll be happy to buy at an even more refined zone on the weekly timeframe.
My Entry Strategy
I’ll enter a long position in the identified zone, expecting a quick upward move. I’ll keep this idea updated as the price evolves, so stay tuned for more details.
Disclaimer
This is my personal analysis and does not constitute financial advice. Trading carries risks, so always conduct your own research and assess your risk tolerance before making decisions.

Cocoa Short: Completed wave 2 (or B) rallyI've previously publish an idea for Cocoa long because of ending diagonal. But it should be clear to an EWer that the down move was a 5-wave structure and thus the long idea was a wave 2 or B idea. Now that we have completed 3-waves up for Cocoa, I think it's time that Cocoa resumes it's down move again. The conservative target is set at the previous support, but I certainly expect it to move way below that target.

Cocao Futures LongCC1! is not net long on the regression break.
The roll long on this commodity is (-1.4%) per a month.
I am entering a EA for this pair with limited risk and controlled entry.

Cocoa Swing LongTrade idea based on supply and demand, intermarket analysis, COT positioning and cross market valuation. Following a structured approach with clear entry, risk management, and confluence factors.

Cocoa shortCocoa is clearly in a downtrend. Friday's candle is clearly a pin bar. For me it makes sense to go short with a target of 6000 USD. I would enter the trade if we break below the low of Friday's candlestick.

The Cocoa Code - Smart Money is Preparing for a Bullish MoveCocoa is setting up for a long trade upon a confirmed daily bullish trend change.
The fundamentals underlying this market suggest a bullish move of some significance is brewing, and would confirm if we see a daily bullish entry trigger.
Commercials at extreme in long positioning relative to last 26 weeks of positioning.
Advisor Sentiment Index at bearish extreme, a great contrarian signal when juxtaposed with the commercials positioning.
Open Interest is at a 3+ year low. Low levels of open interest are generally associated with market bottoms.
Valuation measure against Treasuries & Gold shows Cocoa is undervalued.
True Seasonal tendency for Cocoa to rally into April.
Front month premium implies the commercials want this commodity so bad that they are willing to pay more to acquire it now than later in the future. This implies a commercially driven bull market is at hand.
130 day cycle points to bullish momentum for Cocoa until May.
Accumulation by the commercials is evident via the ProGo & Ultimate Oscillator divergence.
What does this all mean? It means the fundamental conditions underlying this marketplace point towards a bullish move on the horizon.

Long Idea on CC1! (Cocoa)1)Climate change is having a significant impact on cocoa production in West and Central Africa, according to a study by Wageningen University & Research (WUR). The region accounts for more than 70% of global cocoa production. Changes in temperature and rainfall are making some areas less suitable for cocoa cultivation.
2) Seasonality gives us a bullish pattern which is 98% correlated with the actual price
3)quantitative data shows 80% win rate with a good profit factor
4) The price rejected the 50 EMA forming a Pin Bar Candlestick pattern
5) The price also bounced on a demand zone
6) Price is undervalued against several benchmarks

Falling Wedge Pattern: Cocoa FuturesThis is the map of how to trade this rare chart pattern.
This is a textbook sample of Falling Wedge continuation pattern that played out with impressive accuracy.
We have a strong uptrend in 2024 that has been changed
by a large consolidation that took place for the rest of 2024
as it has built the large Falling Wedge (continuation) pattern.
One should focus on the following crucial points and measurements:
1. breakout point where price rises above trendline resistance
it acts as a buy entry trigger (green segment)
2. stop loss - it is located below the lowest valley preceding breakout (red segment)
3. widest part of the pattern - use it to measure the distance to the target adding it to breakout point (blue arc)
4. target (yellow dashed segment)
all of above key parameters are highlighted on the chart.
It's amazing how accurately the price grew towards the target booking over 60% profit.
Next time you can use this map as a guidance.

Can One Bean's Rally Reshape Global Markets?The extraordinary trajectory of cocoa in 2024 has rewritten the commodities playbook, outperforming traditional powerhouses like oil and metals with a staggering 175% price surge. This unprecedented rally, culminating in record prices of nearly $13,000 per metric ton, reveals more than just market volatility—it exposes the delicate balance between global supply chains and environmental factors.
West Africa's cocoa belt lies at the heart of this transformation, where Ivory Coast and Ghana face a complex web of challenges. The convergence of adverse weather conditions, particularly the harsh Harmattan winds from the Sahara and widespread bean disease, and the encroachment of illegal gold mining operations, has created a perfect storm that threatens global chocolate production. This situation presents a compelling case study of how localized agricultural challenges can cascade into global market disruptions.
The ripple effects extend beyond just chocolate manufacturers and commodities traders. This market upheaval coincides with similar pressures in other soft commodities, notably coffee, which saw prices reach forty-year highs. These parallel developments suggest a broader pattern of vulnerability in agricultural commodities that could reshape our understanding of market dynamics and risk assessment in commodity trading. As we look toward 2025, the cocoa market stands as a harbinger of how climate volatility and regional production challenges might increasingly influence global commodity markets, forcing investors and industry players to adapt to a new normal in agricultural commodity trading.

[CC] Cocoa RejectionAfter 2 greats entries on this commodity for an investment, now it's time to reverse the play for the short side.
We start to build a feeler on this level.
Great Trade !

CoCoa Possible Outlook So I saw a trade made on this pair & was curious. So here is what I could see on possible outcome & trades. Of course we would need to go to the 30min to really get into the hourly trades but you can get an idea what to look for.

COCOA SHORTCocoa started a correction on Wednesday, after going parabolic.
It is doing an ABCD pattern, with "C" giving us a point for defining a bearish trendline.
The target is "D", 11,147.
A solid close 4H above the trendline, would invalidate this trade idea.

CocoaCocoa trade. Given the geopolitical and economic context, I expect a possible explosion in cocoa price

Cocoa Futures!!If you like my Idea, Don't forget to Boost and comment on my Analysis.. The recommendations are purely for educational purpose only, consult you financial advisor before trading.
