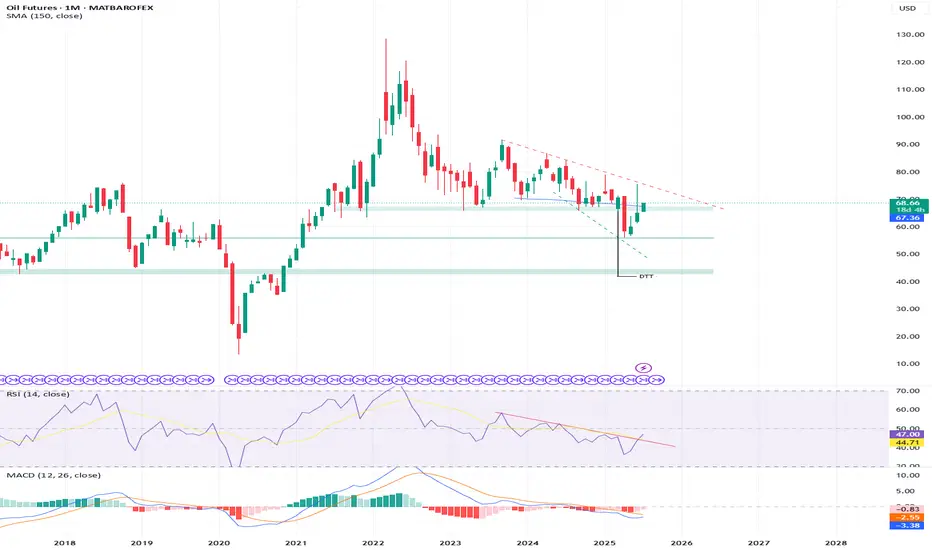
Crude oil------sell near 70.00, target 66.70-63.00Crude oil market analysis:
Recently, crude oil has been rising, and buying is slowly climbing, but the amplitude is not particularly large. The daily line has not formed a large buying pattern. It is currently a technical repair market after falling too much. Today's idea is to sell on the rebound.
Contract highlights
Related commodities

Crude Oil Trade Idea: Intraday mechanicsNYMEX:CL1! NYMEX:MCL1!
Bigger Picture:
Traders should note that news headlines do not always drive the price action. More often, news outlets look for narrative to align with the price action.
Previously, it was about the supply glut and worsening demand due to an uncertain outlook. Now the

WTI Crude Oil Reverses Lower Near $70 ResistanceA bearish engulfing candle has formed on the daily WTI crude oil chart, with its high perfectly respecting the 38.2% Fibonacci retracement just beneath the $70 handle. Given that the bounce from the June low has been relatively weak compared to the sharp decline from $78, I’m now on alert for a pote

Crude Compression, Flagging Into Fire or FailureCrude Oil has been grinding higher within a clean rising wedge (bearish flag), forming within the aftermath of a strong sell-off. Price is now testing a key Intraday Fair Value Gap (1H FVG) inside a broader HTF Macro Supply Zone, while respecting a steep trend line of support.
This structure sets u

CL1! Short Setup – Fading Into Volume Shelf📉 CL1! Short Setup – Fading Into Volume Shelf
🔹 Context:
Price just tapped into a heavy upper volume shelf (68.35–68.50) — the exact area where the prior breakdown started. This zone aligns with rejection highs and the upper edge of the VRVP profile.
📌 Setup Logic:
🔺 Entry: 68.36–68.50 (in

CRUDEOIL FUTURE - BULLISH VIEWCrudeoil just showed a reversal from 0.618 golden fibonnaci zone. It may go till 6000-6100 levels in coming weeks with 5700 as strong support.
please do your own research before taking any trades. This chart is only for educational purpose

WTI Crude - Turning Bullish? Published as a supplementary analysis for BRENT CRUDE and LIOC, with further coverage to follow.
* WTI has successfully reclaimed its 4-year support line, which was breached in April 2025.
* The Monthly Momentum Indicator reveals a robust bullish breakout, signaling renewed strength.
* As long a
CL down sub $60 before moving up above $73Expected support or reversal zone based on last swing high for CL is at $60. This matches with 0.786 fib level of last move up, suggesting a standard SBS structure forming. Expecting a move up to at least $73 (fib 0.236), possibly also well beyond this.
Based on time fib of last swing high I expec

Where’s the Oil Price Heading Amid Rising Supply and Weak DemandThe eight oil-producing nations of OPEC+ agreed to raise output in August, opting for a larger-than-expected increase. OPEC+ cited a steady global economic outlook and healthy market fundamentals. The crude oil market remains under pressure from subdued prices, persistent supply growth, and uncert

Crude Oil: Key Breakout Levels Suggest Bullish MomentumCurrent Price: $65.81
Direction: LONG
Targets:
- T1 = $67.45
- T2 = $69.30
Stop Levels:
- S1 = $64.20
- S2 = $62.50
**Wisdom of Professional Traders:**
This analysis synthesizes insights from thousands of professional traders and market experts, leveraging collective intelligence to identif

See all ideas
A representation of what an asset is worth today and what the market thinks it will be worth in the future.
Displays a symbol's price movements over previous years to identify recurring trends.
Frequently Asked Questions
The nearest expiration date for Crude Oil Futures (Feb 2020) is Jan 21, 2020.
Traders prefer to sell futures contracts when they've already made money on the investment, but still have plenty of time left before the expiration date. Thus, many consider it a good option to sell Crude Oil Futures (Feb 2020) before Jan 21, 2020.