Oil Market Sentiment Shifts After Trump’s Urgent Warning, but...On June 23, 2025, at 9:35 AM, President Donald J. Trump issued a stark warning via social media:
"EVERYONE, KEEP OIL PRICES DOWN. I’M WATCHING! YOU’RE PLAYING RIGHT INTO THE HANDS OF THE ENEMY. DON’T DO IT!"
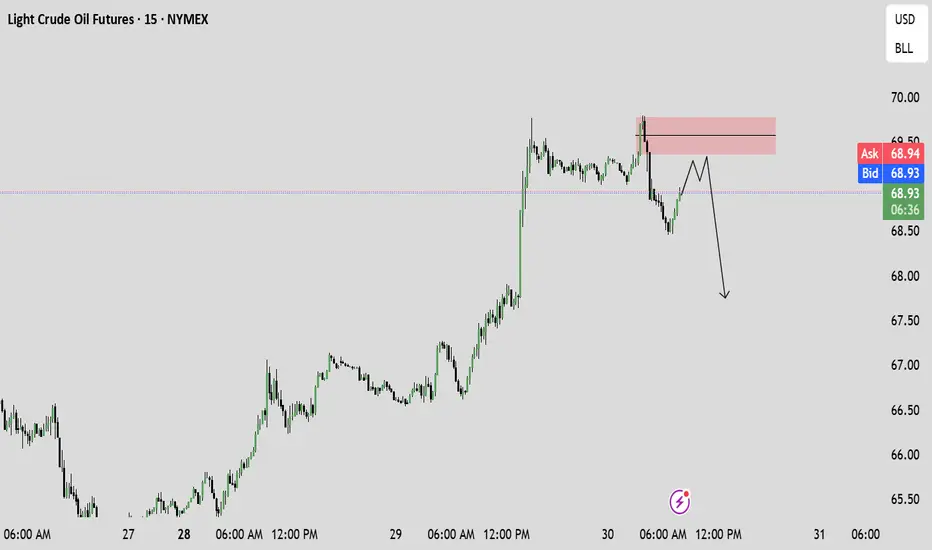
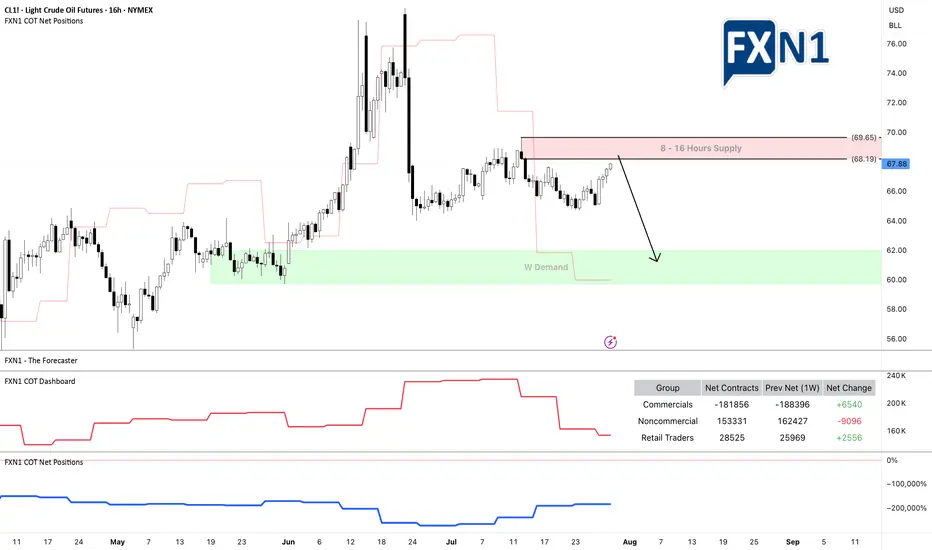
Since his post, oil prices experienced a notable bullish impulse. From both fundamental and technical perspectives, the market is now approaching a 16-hour supply zone, which could serve as a potential resistance area.
Additionally, I’ve observed a divergence in trader positioning: non-commercial traders increased their short positions significantly last week, while retail traders remain long. This divergence between price action and non-commercial positions suggests a possible shift in momentum, and I am currently eyeing a short setup.
As always, I encourage traders to conduct their own analysis. The trader featured below operates on the D1 timeframe and focuses on scalping, which can be useful for short-term entries.
Stay cautious and keep an eye on how the market reacts near the identified supply zone.
✅ Please share your thoughts about CL1! in the comments section below and HIT LIKE if you appreciate my analysis. Don't forget to FOLLOW ME; you will help us a lot with this small contribution.
CLF2016 trade ideas
Crude oil: Sell around 70.20, target 65.00-64.00Crude Oil Market Analysis:
Yesterday's crude oil market was very strong, with buying driving the market higher. The daily chart ultimately closed with a clear bullish candlestick. Buying on the daily chart is testing the resistance level between 70.00 and 70.60. After two consecutive days of bullish closes, and with clear bullish candlesticks, I predict another surge today. Let's look at the daily chart. The daily chart shows a significant rebound after a significant drop. Today, focus on selling opportunities between 70.00 and 70.60. A break of this level will change the overall selling trend. The strategy remains to sell high and be bearish.
Fundamental Analysis:
Today, focus on the ADP employment data and the EIA crude oil inventory data. The key news will be the interest rate results during the US trading session, along with speeches.
Trading Recommendations:
Crude oil: Sell around 70.20, target 65.00-64.00

WTI(20250723)Today's AnalysisMarket news:
White House officials plan to visit the Federal Reserve headquarters on Thursday local time.
Technical analysis:
Today's buying and selling boundaries:
65.22
Support and resistance levels:
66.22
65.85
65.61
64.84
64.60
64.22
Trading strategy:
If the price breaks through 65.61, consider buying, the first target price is 65.85
If the price breaks through 65.22, consider selling, the first target price is 64.84
CL : Key levelsFrom the level of 66.23 we can wait for short-term sales.
From the level of 61.12 you can at least buy short-term, and if the price draws certain patterns on it, you can expect a good long position.
The other levels are still inactive, but the market will see them. When they become active, I will inform you.

Oil Trap Activated – Limit Orders Set for the Big Score💥🛢️Crude Oil Vault Breach Plan – DCA Heist Begins!🧨💰
🚨Asset: CL1!
📈Bias: BULLISH RAID MODE ON
🎯Target: $74.50
🛡️Stop Loss: $67.50
🔑Entry: ANY LEVEL – Thief stacking limit orders like layers of gold bars 💼⚖️ (DCA Mode Activated)
🕵️♂️Thief Trader is not chasing, we're ambushing 🧠 — scaling in smart with multiple limit traps. The crew never FOMOs, we trap the market 🎯.
💣This is a layered loot plan, not for weak hands. Watch how we load up quietly while market sleeps 😴, then hit hard when the vault cracks open 🔐.
Support this heist by smashing that ❤️LIKE button
💬 Comment your plans below & join the real thief squad
🤝 Together we rob the market — LEGALLY & LOGICALLY
#ThiefTrader #OilHeist #CL1 #BullishTrap #DCA #CrudeOilStrategy #SmartMoneyPlay #MarketRobbery #TeamLoot #NoRetailPanic
Price Stability Signals Long OpportunityCurrent Price: $65.45
Direction: LONG
Targets:
- T1 = $67.25
- T2 = $68.50
Stop Levels:
- S1 = $64.15
- S2 = $63.25
**Wisdom of Professional Traders:**
This analysis synthesizes insights from thousands of professional traders and market experts, leveraging collective intelligence to identify high-probability trade setups. The wisdom of crowds principle suggests that aggregated market perspectives from experienced professionals often outperform individual forecasts, reducing cognitive biases and highlighting consensus opportunities in Crude Oil.
**Key Insights:**
Crude Oil prices are showing signs of stability around the $65.45 mark, creating opportunities for upside potential. Recent consolidation indicates underlying strength in the market, supported by solid demand forecasts and tight global supply, making a long position viable for the near term. However, traders should remain cautious, as any unexpected geopolitical or macroeconomic developments could trigger volatility.
**Recent Performance:**
Crude Oil has seen moderate fluctuations over the past week, with prices swinging between $64 and $66. The commodity appears to be recovering from recent dips, supported by stronger-than-expected inventory reports and OPEC's cautious stance. Overall trade volumes remain healthy, reflecting a gradual return of confidence among investors.
**Expert Analysis:**
Market sentiment among analysts leans bullish for the upcoming week. Experts point to various bullish indicators, including declining global stockpiles and expectations of stronger winter demand across major economies, particularly in the U.S. and China. Meanwhile, technical charts reveal sustained support near $65, suggesting room for an upward breakout.
**News Impact:**
OPEC+ members have reiterated their commitment to production cuts, alleviating fears of oversupply. Additionally, easing recession concerns and a potential rally in the broader commodities market further support the case for higher Crude Oil prices. However, traders should watch for Federal Reserve statements and potential shifts in interest rate policy that could impact demand dynamics.
**Trading Recommendation:**
Considering Crude Oil's current stability and positive outlook, traders should enter a long position targeting $67.25 and $68.50 while placing stop levels at $64.15 and $63.25 to manage downside risk effectively. The interplay of favorable supply-demand dynamics and technical indicators presents an attractive risk-reward scenario for upside participation.

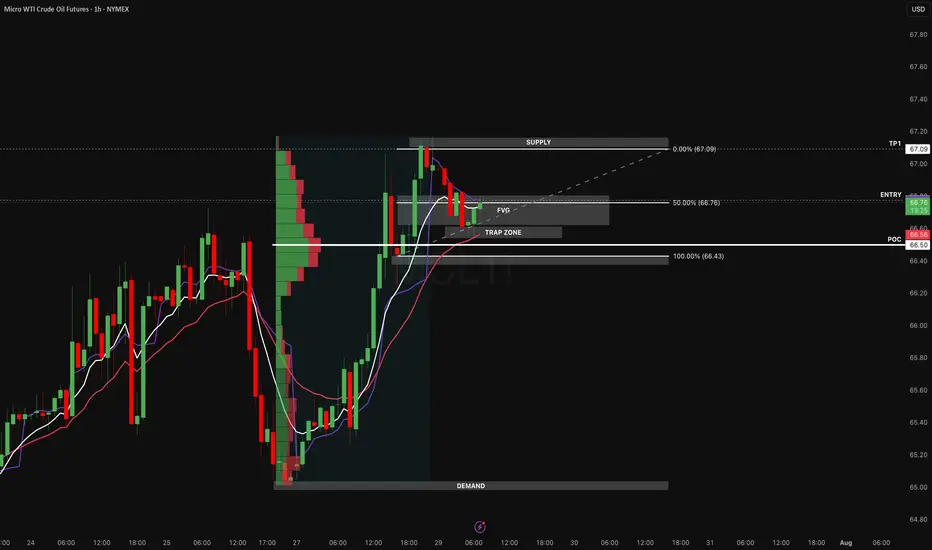
Oil’s Next Bullet: Locked, Loaded, Waiting at ValueOil made a clean move from 66.43 to 67.09 no noise, no hesitation and now it’s consolidating right where we want it: above the most important value zone of the leg. We’re not chasing green candles here. We're setting up for a measured, high-confluence re-entry at the point of balance.
This is the kind of setup we like to take at Staakd value-based, built off structure, supported by data, and always defined by risk.
Why We Like This Long
1. Fair Value Gap (FVG)
There’s a clear imbalance from 66.70–66.76 this is where price moved aggressively and left inefficiency behind. When price pulls back into an FVG with structure still bullish, we treat it like a reload zone not weakness.
2. POC (Point of Control) from Volume Profile
We anchored a Fixed Range Volume Profile from the impulse low to recent high, and the POC sits at 66.56, just under the FVG. That’s where most volume traded meaning institutions likely built their position there. If price reclaims this area after a dip, it’s a strong signal buyers are still in control.
3. Fib 50% Retracement
The 50% level of the impulse move (66.76) aligns with the FVG midpoint. That’s a psychological retracement level where trend traders and mean reversion players often meet.
4. Structure & Momentum Still Intact
- EMAs are stacked bullish: 9 > 21 > 50
- No lower low has formed
- Volume dropped on the pullback (typical in bull flags or controlled consolidations)
Plan of Attack
- Entry Zone: Anywhere from 66.56–66.76 (FVG, POC, fib confluence)
- Trigger: Look for a wick below and reclaim of FVG engulfing candle, ORB break, or VWAP reclaim
- TP1: 67.09 (supply + liquidity sweep)
- SL: Below 66.43 (demand origin + invalidation of trend)
What Invalidates This Trade
A clean break and hold below 66.43 means the structure has flipped. At that point:
- The FVG is fully filled and disrespected
- Demand is broken
- We’d likely reassess for a reversal setup, not continuation
- No egos, no praying. If we’re wrong, we’re out.
Why This Matters
We don’t trade predictions, we trade probabilities based on imbalances, value zones, and participation. When price returns to where the real business was done (the POC), we wait for confirmation and execute without emotion.
This setup aligns with our model:
- Value-based entry
- Tight, clearly defined invalidation
- Measured upside to recent high
- Multiple technical confluences
All that’s left now is patience the setup is built, the levels are mapped, and the edge is clear.
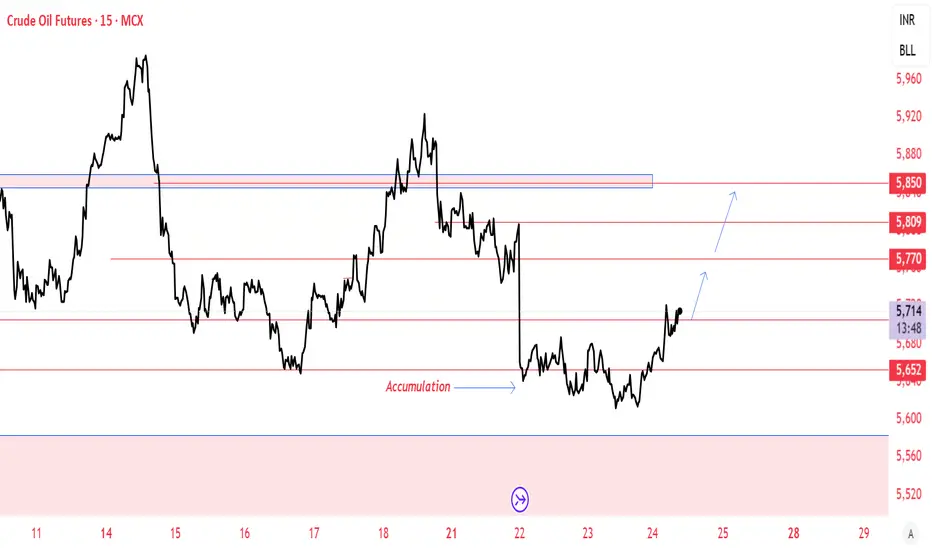
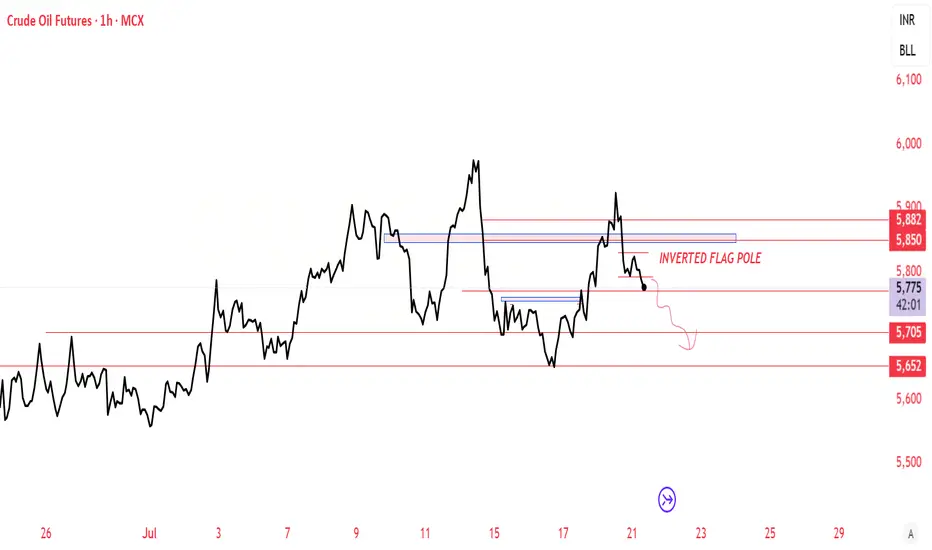
Crudeoil MCX - Bullish ViewAccumulation Happened Near Support. May see 5800-5820 after drift fall.
Please do your own research before taking any trading decisions
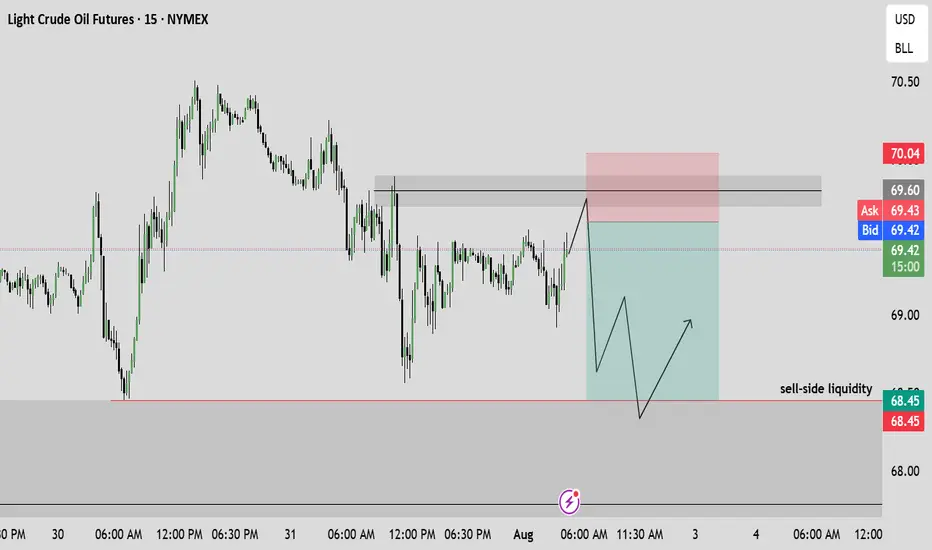
US OILShort term bearish view in US OIL, I want price to drop below the OLD Low before continuing the upside momentum
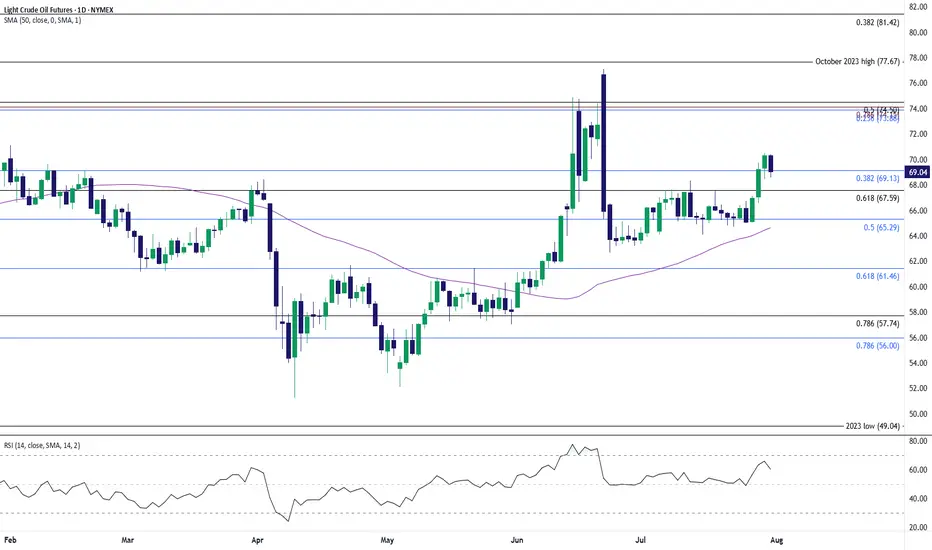
Oil Price Pulls Back to Keep RSI Out of Overbought ZoneThe recent rally in oil appears to have stalled as it struggles to extend the bullish price series from earlier this week, with the Relative Strength Index (RSI) pulling back ahead of overbought territory.
Lack of momentum to hold above the $67.60 (61.8% Fibonacci retracement) to $69.10 (38.2% Fibonacci retracement) zone may push the price of oil toward $65.30 (38.2% Fibonacci retracement), with a breach of the monthly low ($63.36) bringing $61.50 (61.8% Fibonacci retracement) on the radar.
At the same time, the price of oil may defend the advance from earlier this week should it hold above the $67.60 (61.8% Fibonacci retracement) to $69.10 (38.2% Fibonacci retracement) zone, with a move/close above the $73.90 (23.6% Fibonacci retracement) to $74.50 (50% Fibonacci retracement) region bringing the June high ($77.09) on the radar.
--- Written by David Song, Senior Strategist at FOREX.com
Crude oil-----sell near 66.00, target 65.00-63.00Crude oil market analysis:
The recent daily crude oil line has been fluctuating slightly. It is still bearish to sell at a high price. Crude oil is unlikely to rebound or rise sharply without fundamental support. The hourly crude oil suppression position is 66.40 and 67.50. Today we are close to 66.00 to consider selling opportunities. The daily moving average of crude oil is starting to go down. If 64.00 is broken, it will start to fall sharply.
Operational suggestions
Crude oil-----sell near 66.00, target 65.00-63.00


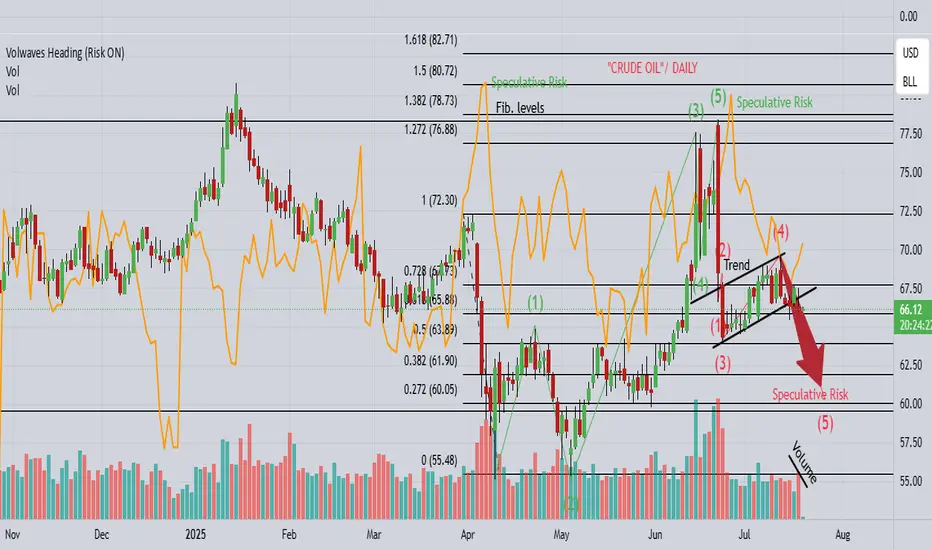
CL "OIL" continues the drop towards $60!1). Wave 5 drop needs a completion lower! 2). Risk is selling off! 3). Volume is falling! 4). Price appears to be heading towards lower market sentiment! 5). Trump is imposing more Tariffs, which is likely causing deeper corrections!
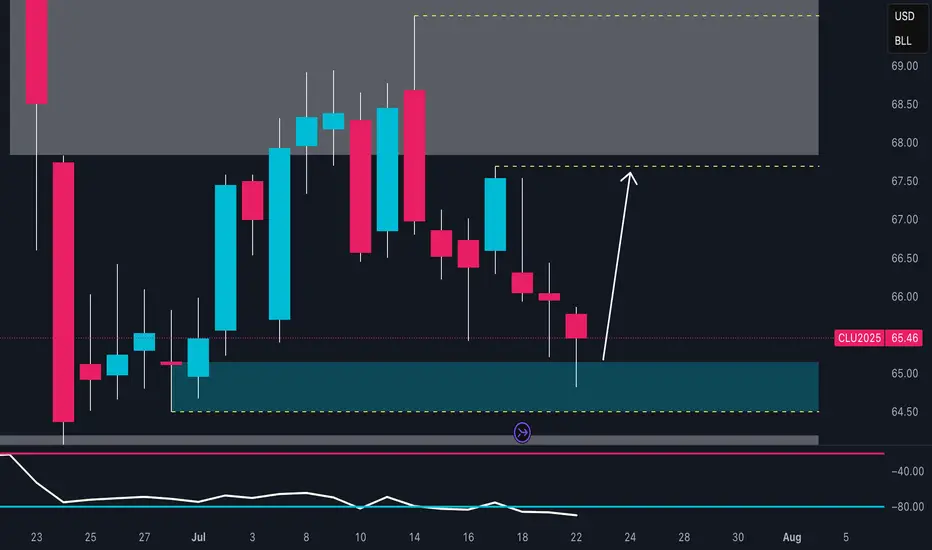
Crude Oil Rebound Incoming? Key Demand Zone 📈 1. Technical Analysis – Daily Chart (CL1!)
The price has returned to a demand zone between 64.60 and 65.30, an area that previously triggered strong bullish reactions.
The July 22nd candle shows a clear lower wick, indicating potential buyer absorption and a possible short-term reversal.
The next key resistance lies between 67.80 and 68.80, which aligns with a well-defined supply zone.
Daily RSI remains weak but shows signs of bullish divergence, suggesting potential accumulation.
Bias: bullish from current levels, targeting 67.50 – 68.00. Invalidation on a daily close below 64.40.
2. Institutional Sentiment – COT Report (CFTC, July 15, 2025)
Non-Commercials (Speculators)
Long: 308,915 (↓ -24,223)
Short: 146,488 (↑ +22,724)
Net Position: sharply declining → bearish divergence in speculative sentiment
Commercials (Hedgers)
Long: 857,803 (↑ +66,342)
Short: 1,046,199 (↑ +18,118)
Net Position: still negative, but improving → reduced hedging = less downside pressure
📉 Interpretation:
Funds are closing longs and adding shorts, showing bearish positioning. However, commercials are slowly reducing their hedging exposure, which could indicate short-term stabilization if the technical support holds.
3. Seasonality
Periods analyzed: 20, 15, 10, 5, and 2 years
July historically shows negative average returns:
-0.71% (20Y)
-1.26% (15Y)
-1.37% (10Y)
The seasonal pattern indicates continued cyclical weakness into August.
📌 Interpretation:
The summer period typically brings seasonal bearish pressure, which aligns with current 2025 performance.
🌐 4. Macro & Fundamentals
EIA inventory builds for 3 consecutive weeks → demand weakness in the U.S.
No additional OPEC+ cuts announced → supply remains ample
Stable inflation data in the U.S. and China → no uptick in energy demand
Overall macro data is neutral with a slightly bearish short-term bias
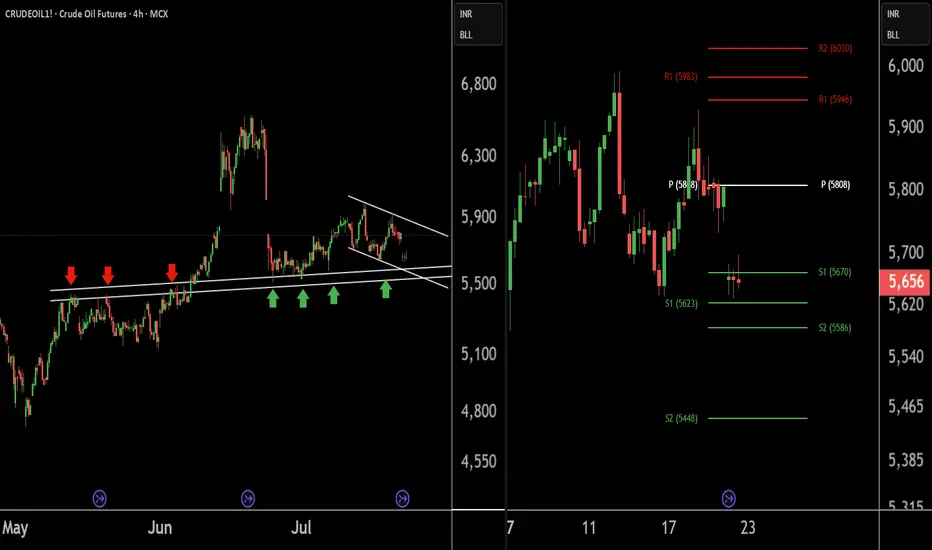
Crude Oil Buying Alert: Strategic Entry Point IdentifiedThere are two charts of Crude Oil on the 4-hour timeframe.
In the first chart, Crude Oil is sustaining near its lower point (LOP), with a support range of 5540-5580.
A-VWAP is also providing support to Crude Oil around the 5580 level.
The Pivot Point is also supporting Crude Oil around the 5580-5620 level.
If this level is sustain then we may see higher prices in Crude Oil.
Thank you !!
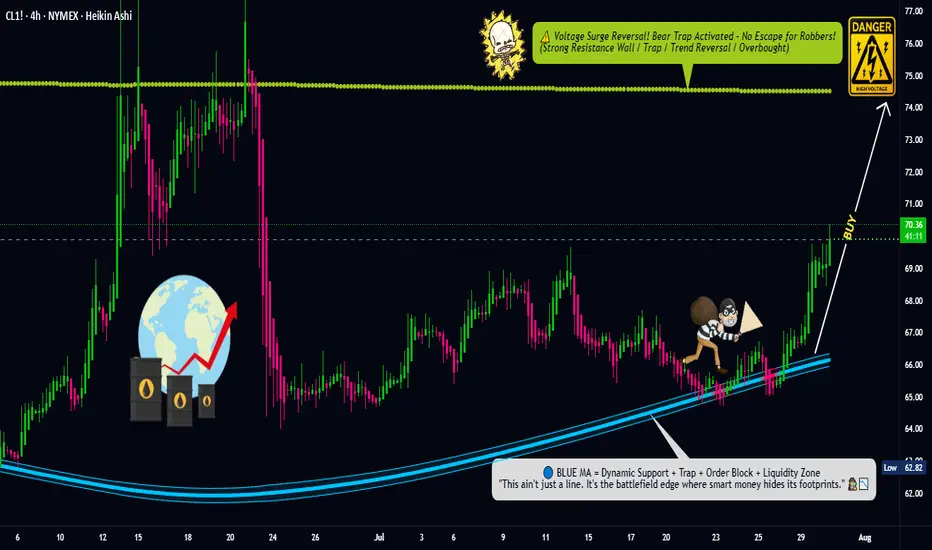
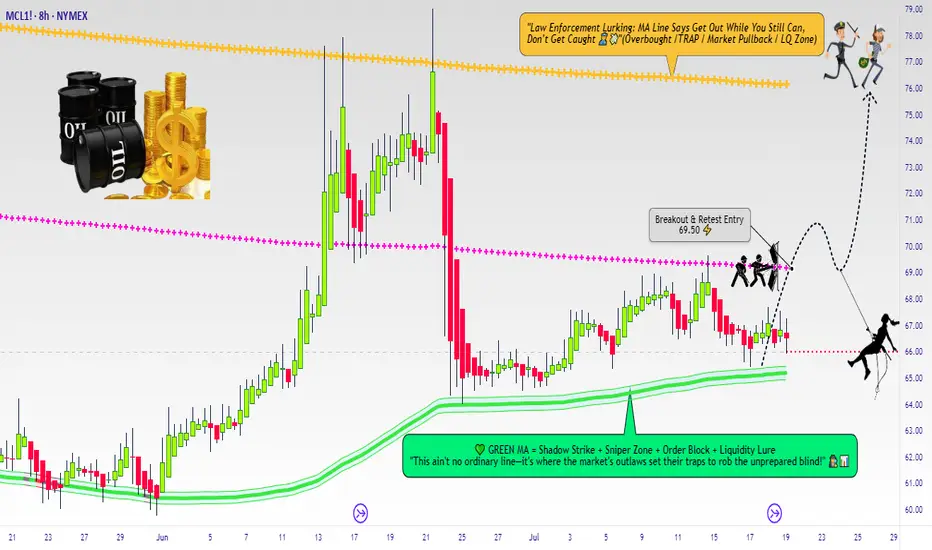
Micro WTI Swing Breakout Setup – Robbing Liquidity the Smart Way🛢️ "Crude Ops: The WTI Energy Vault Breakout Plan" 🛢️
(A Thief Trader Swing Setup | MA Breakout Trap Heist 💰💥)
🌍 Hola! Bonjour! Marhaba! Hallo! Hello Robbers & Market Movers! 🌟
Welcome to another high-voltage heist mission straight from the Thief Trading Den. This ain’t just a chart—this is an Energy Market Extraction Plan based on real smart money footprints 🔎.
🔥 Master Robbery Setup: MICRO WTI CRUDE OIL FUTURES 🎯
We got a bullish breakout alert from the shadows! This is not a drill.
💣 ENTRY STRATEGY
💼 "The Heist Begins Above 68.50"
Watch the Moving Average (MA) zone closely—this is where weak hands get trapped and we slide in with stealth limit or breakout orders:
🛠️ Plan of Entry:
Buy Stop Order: Just above 68.500 (after confirmation of breakout ✅).
Buy Limit Layering (DCA): On pullbacks around 15m/30m swing lows for precision entries.
🧠 Pro Tip: Use alerts to catch the exact entry ignition spark—don't chase, trap with patience like a true thief.
🛑 STOP LOSS (SL)
⚠️ "No SL? That’s a rookie mistake."
SL should only be placed post-breakout using the 8H wick-based swing low (around 66.50).
💡 SL is your personal vault door—set it according to:
Lot size
Risk appetite
Layered entry strategy
📌 Reminder: No SL or order placement before breakout. Let the market show its hand first.
🎯 TARGET ZONE (Take Profit)
Primary Target: 76.00 🏁
But hey... the smartest robbers escape before alarms ring — so trail that stop, secure your profits, and vanish like smoke 🥷.
💥 FUNDAMENTAL & SENTIMENT CATALYSTS
🔥 Current bullish energy comes from:
📉 USD weakness
🏭 Crude inventory drawdowns
⚖️ Geopolitical supply shocks
🐂 Hedge funds scaling long per latest COT data
📊 Intermarket cues from risk-on assets
🧠 Do your diligence: Go check fundamentals, COTs, and macro narratives before entering. Info = Edge.
📢 RISK MANAGEMENT NOTE
🚨 Don't go wild. Market is volatile, especially around:
News drops 📉
Fed or OPEC speeches 🎙️
Crude inventory reports 🛢️
Pause entries during news events. Use trailing SLs to lock the vault behind you.
❤️ SUPPORT THE ROBBERY MISSION
💣 Smash that BOOST button if this plan hits your nerve.
Let’s keep robbing liquidity zones together and growing the Thief Trader Brotherhood 🕵️♂️💰.
📡 Stay tuned for the next stealth heist drop. We rob the market with class. 💎🚀
Crude oil------sell near 68.80, target 66.00-62.00Crude oil market analysis:
Recent crude oil is actually very easy to operate. Sell when it rebounds to a high position. Don't worry about the position. In addition, the daily K-line has also begun to decline, and it is difficult to form a large rebound. The new daily moving average begins to sort. If there is no fundamental support in the future, crude oil has a lot of room to fall, and it will fall below 58 in the future. Sell it when it rebounds to around 68.80 today.
Fundamental analysis:
Today is a holiday in Tokyo, Japan. In addition, there is no major data this week. We focus on the fundamentals. Trump's tariffs are still a focus.
Operational suggestions:
Crude oil------sell near 68.80, target 66.00-62.00

CRUDEOIL - Bearish viewLooking at current scenario of Tarif and other major supply in crudeoil, technical also supporting the bearish view.
We can see Flag Pole breakdown on 1 hr time frame.
This is only for educational purpose
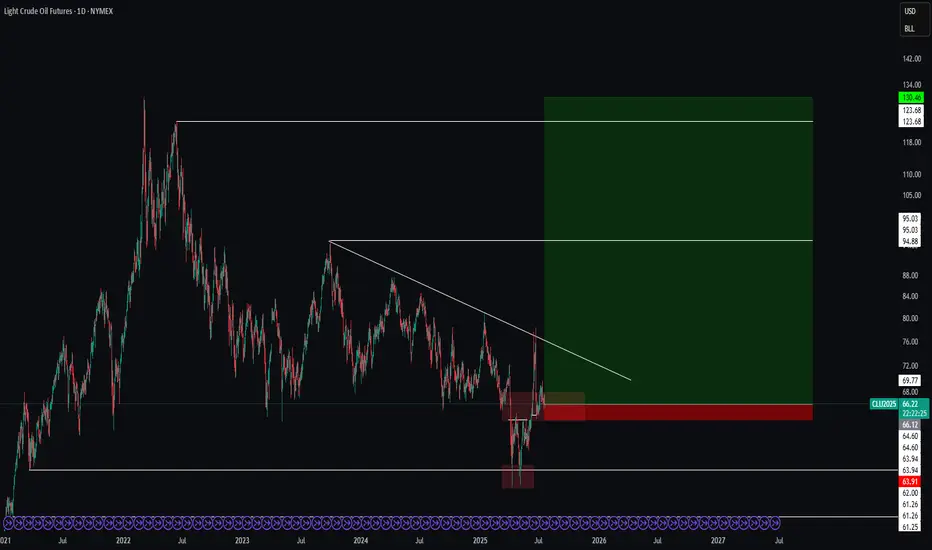
[CL] USOIL ideaHere is my point of view on US Oil future ( NYSE:CL ) with a very large TP with intermediate ones to manage the position.
Let's start to build a position on this levels right now and see how it reacts to add more on the push up.
Great Trade !
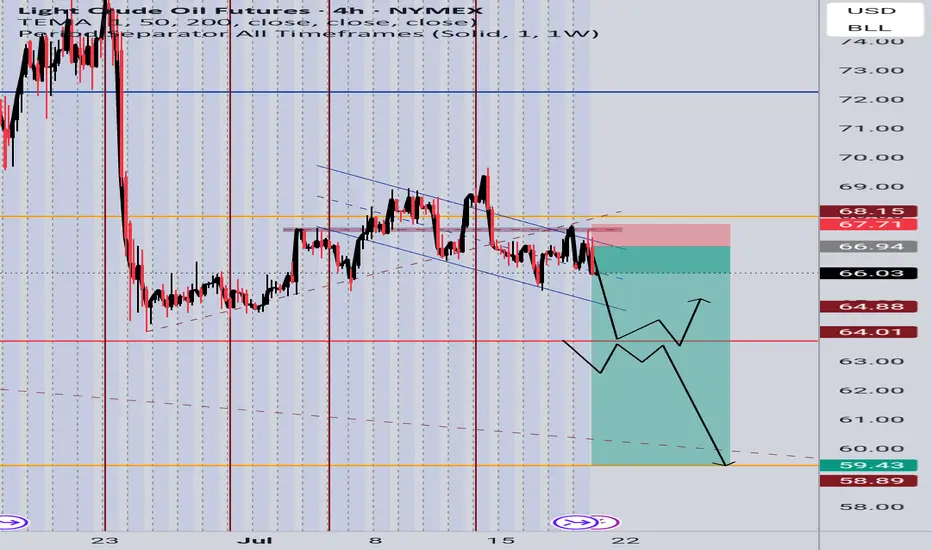
Light Crude Oil Futures (CL1!) - Potential Bearish Continuation Price is currently respecting a descending channel after rejecting the 68.00–68.15 resistance zone. We've observed:
A strong bearish impulse breaking key structure.
Retest of a previous support now acting as resistance (66.94)
Downside targets around 64.00, and possibly extending to the 59.50–58.90 support zone.
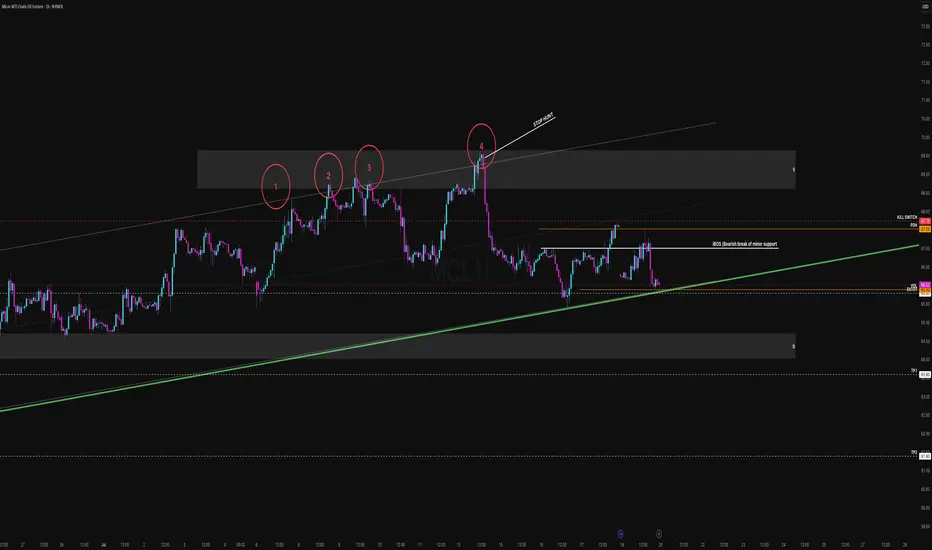
4-Tap Rejection. Compression. Breakdown Incoming?This is a mechanical short setup mapped out ahead of the Sunday futures open. It’s based on clean structure, distribution signals, and a confirmed internal shift in trend via iBOS but it’s not a blind breakdown short. The setup respects demand proximity, prior lows, and the risk of early-week traps. Read on.
Structure Breakdown
Over the last two weeks, price has rejected four times from a defined supply zone ($67.50–$68.50). On the 4th tap, we saw a classic stop hunt price wicked just above previous highs, then failed to hold. That failure led to an internal break of structure (iBOS), as price dropped through a prior key low and is now compressing just above a rising daily trend line. This forms the classic "liquidity grab → structure shift → compression" model and we’re now watching for the final leg lower.
Short Setup Summary
Entry Zone - 66.00–65.90 (on break & retest)
Stop Loss (Kill Switch) - 67.50 above structural trap high
TP1 63.80 - front-run of demand
TP2 61.40 - full extension to macro demand
This is a structure-first play no indicators, no guesswork. Only confirmed breaks, trap recognition, and clean execution.
Demand + PDL Conflict
It’s important to note, the short trigger area (around 66.00) sits very close to both a demand zone and the Previous Day’s Low (PDL). This makes it a high-probability bounce zone if price stalls. It also means the first move might be a fake out before the real leg begins. That’s why the short is only valid if we get a clean break, retest, and failure, not just a trend line touch or spike.
Kill Switch Logic
The stop is placed at 67.50, just above the stop hunt wick.. If price breaks above this, the setup is off plain and simple. The market would be shifting toward re-accumulation, and we won’t fight that.
Sunday Futures Open Considerations
This plan is published before the Sunday 6PM open. Crude is notorious for weekend-induced volatility. Thin order books and macro news = unreliable early moves.
Three Potential Scenarios:
1. Spike into Kill Switch
2. Watch for a fast trap above $67.00
3. If price rejects back under $66.80, it becomes a higher-quality short
Wait for confirmation no entry on open. Gap Down / Immediate Breakdown. If price breaks through $65.90 fast, wait for the pullback into structure on Monday to short safely. Push and Hold Above 67.50
Setup invalidated
- Structure rotates bullish, we stand aside
- Stay mechanical. Let the market confirm bias before executing.
Staakd Model Checklist
1. Quad Rejection in Supply
2. Stop Hunt Confirmed (Tap #4)
3. iBOS (Internal Break of Support)
4. Daily Trend line Compression
5. Clean Risk Control via Kill Switch
6. Demand and PDL Caution Integrated
This is how we structure high-conviction trades no emotion, no indicators, just mechanics.
ID: 2025 - 0146.16.2025
Trade #14 of 2025 executed.
Trade entry at 60 DTE (days to expiration).
BULLISH options trade executed on Crude Oil. Once price level of $75.00 gets taken out, this trade will get adjusted to secure a risk-free trade. Targets will be 100% ROI based upon this being a balanced bullish butterfly construct.
Defined risk
Defined reward
Happy Trading!
-kevin