Platinum rally runs out of steam as nearterm outlook tilts shortThe Rally That Looked Unstoppable
Through the spring and into early summer, platinum looked like it had finally broken free of its long-standing range. From April to late June, prices surged over 36% to hit 11-year highs above $1,500/oz. The move was powered by a perfect storm of short-term drivers.
China was the first spark. In April and May, imports jumped to the strongest monthly volumes in a year, driven by a rebound in jewellery demand and the kind of bargain-hunting Chinese buyers are known for when a metal is still “out of favour.”
Source: Bloomberg
In recent years, China’s surplus platinum build has steadily removed metal from the global pool, tightening availability elsewhere.
The smaller 2025 figure reflects data only through June, which, if annualised, is on pace with prior years.
The physical pull was also amplified by U.S. tariff fears. Although platinum was eventually spared from the April tariff list, the initial uncertainty yanked metal into NYMEX warehouses, draining those of London and Zurich.
Source: Bloomberg
This created localised tightness and premiums, spiking lease rates to levels not seen in years. Even after easing from July’s extreme of over 35%, the implied one-month rate is holding above 10%, a far cry from the near-zero levels typical in stable conditions.
Rates at this level reflect a market where physical metal is scarce and owners are demanding substantial compensation to lend it out.
Source: Bloomberg
At the same time, South Africa, the source of nearly three-quarters of global mined platinum, was struggling through weather damage, power grid instability, and refinery bottlenecks. Q1 output slid to 715,000 ounces from 1.16 million ounces a year earlier, a 38% decline YoY.
Even U.S. policy gave a boost. On July 4, a bill ending EV subsidies and relaxing emission penalties was signed, effectively making internal combustion engines (ICE) more attractive near-term. Automakers stockpiled catalytic converter metal ahead of the change, adding another layer to already feverish demand.
When the Fuel Runs Low
But the same factors that propelled the rally are now starting to lose their force. Chinese physical buying has slowed sharply since prices broke above roughly $1,050/oz. The country’s import pullback leaves the market without its most aggressive marginal buyer, and without a fresh demand impulse, prices have begun to drift.
The tariff-driven warehouse reshuffle has also cooled. Lease rates remain elevated versus normal, but they’ve fallen from the panic highs of June.
The term structure is less steep, and options skew, which blew out during the rally, has moderated. In past cycles, those reversals have lined up with corrections.
South African supply is staging a recovery in H2, with the worst of the weather and maintenance disruptions behind it. Meanwhile, the July auto catalyst stockpiling in the U.S. was always going to be front-loaded. Without a sustained change in global policy, the longer-term trend of muted ICE vehicle demand still hangs over platinum’s largest use-case.
Source: Sprott
Even investor enthusiasm is showing cracks. ETF holdings in North America had been climbing through the rally but have turned patchy in recent weeks. Several funds saw profit-taking, leaving futures traders without an investment-flow tailwind to fall back on.
Deficits Without Danger
The World Platinum Investment Council’s Q1 update still projects a large market deficit for 2025, between half a million and nearly a million ounces. But deficits don’t bite the same way when there’s a stockpile buffer.
Above-ground inventories remain around 9 million ounces, equivalent to roughly 14 months of demand. That is more than enough to bleed into the market when tightness indicators flare, taking the sting out of the “shortage” narrative.
There’s also a price-risk valve in the form of palladium. The auto industry has flexibility in catalyst metal choice, and a platinum premium over palladium approaching 30% would tempt manufacturers to reverse-substitute away from platinum.
Why the Balance Now Tilts Short
The rally’s foundation, which is a combination of China’s aggressive buying, microstructure stress, and front-loaded industrial demand, is now eroding.
Technicals confirm the shift: momentum indicators like RSI are rolling over, with platinum trading below the 9-day moving average for the first time since the rally began:
Term structure and skew are normalising, lease rates are easing, and the physical market is no longer under siege.
That doesn’t mean platinum can’t spike on a headline; this market has a history of violent squeezes. But in the absence of a new catalyst, the path of least resistance near-term is lower. Any bounce into resistance offers an opportunity to build a short, with stops placed to respect the risk of sudden microstructure shocks.
The bullish story that carried platinum to multi-year highs was compelling because every driver pointed the same way. Now, most of them are pointing the other. That is when short setups work best; not by betting against strength, but by recognising when the strength itself is running out of air.
Hypothetical Trade Set-up
With October platinum futures consolidating after an 11% drop from the July peak and failing to break decisively above $1,360, fading physical tightness and softening demand momentum set up a tactical short.
Traders can deploy CME Platinum PLV2025 Futures to express this view. Each contract requires margin of $5000. Alternatively, traders could deploy the micro platinum futures which provide exposure to 1/10th the notional of the standard contract.
Entry : $1,340/oz (current price)
Target : $1,296/oz (recent swing low)
Stop Loss : $1,370/oz (recent pivot resistance)
Profit at Target:
Contract size: 50 troy ounces
Price move: $1,340 – $1,296 = $44
$44 × 50 oz = $2,200 per contract
Loss at Stop:
Price move: $1,370 – $1,340 = $30
$30 × 50 oz = $1,500 per contract
Reward-to-Risk Ratio: 1.47×
MARKET DATA
CME Real-time Market Data helps identify trading set-ups and express market views better. If you have futures in your trading portfolio, you can check out on CME Group data plans available that suit your trading needs tradingview.com/cme.
DISCLAIMER
This case study is for educational purposes only and does not constitute investment recommendations or advice. Nor are they used to promote any specific products, or services.
Trading or investment ideas cited here are for illustration only, as an integral part of a case study to demonstrate the fundamental concepts in risk management or trading under the market scenarios being discussed. Please read the FULL DISCLAIMER the link to which is provided in our profile description.
PLQ2025 trade ideas

Platinum (PL)Tight stop hoping fo a real break out -Taking a long position in Platinum, anticipating a breakout to the upside from the current channel. Managing the position with a tight stop loss.
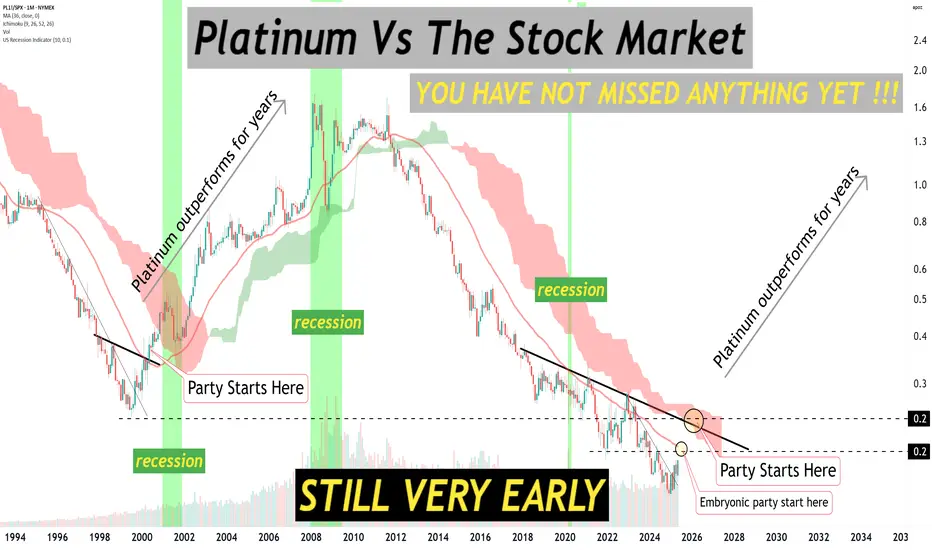
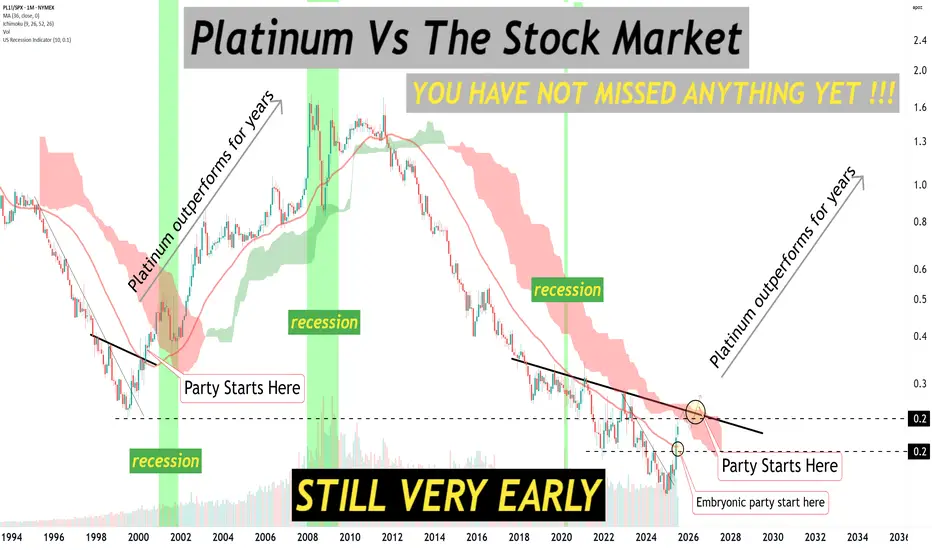
Not sure what all the fuss is about platinum.Not sure what all the fuss is about platinum.
When I see platinum's performance against the stock markets, I can clearly see the bull era has NOT started yet.
Still soo very early...
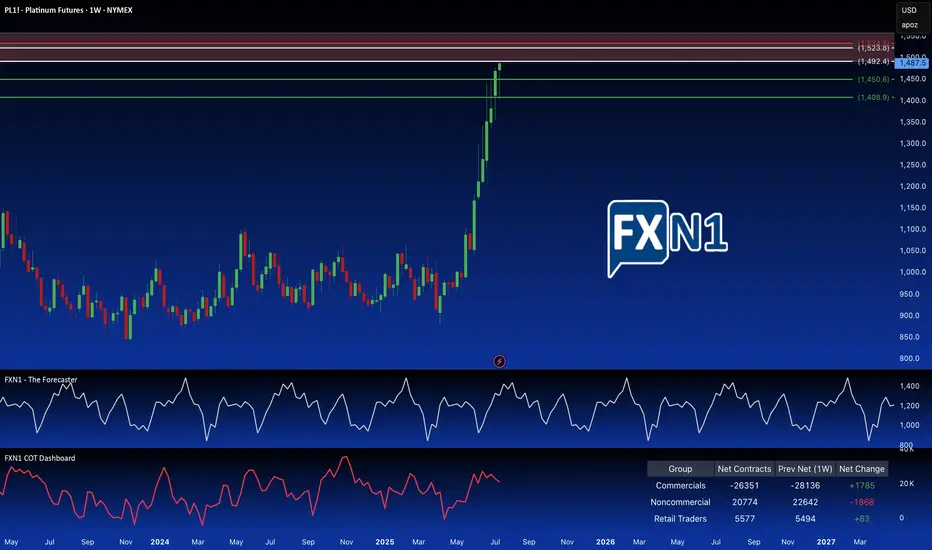
Platinum: Breaking the Supply Barrier?I'm adding a second Platinum position. Price has hit a strong weekly supply area, also a significant monthly supply zone. I'm anticipating a reversal here, as non-commercial holdings are decreasing, and seasonal patterns suggest a potential trend change. To further capitalize on potential upside, I've placed a pending order above the primary supply zone, at a slightly higher, but still relevant. These are older, established and fresh supply zones.
(Note: Reducing the chart size may help to better visualize the long-term significance of these overlapping areas.)
✅ Please share your thoughts about PL1! in the comments section below and HIT LIKE if you appreciate my analysis. Don't forget to FOLLOW ME; you will help us a lot with this small contribution.
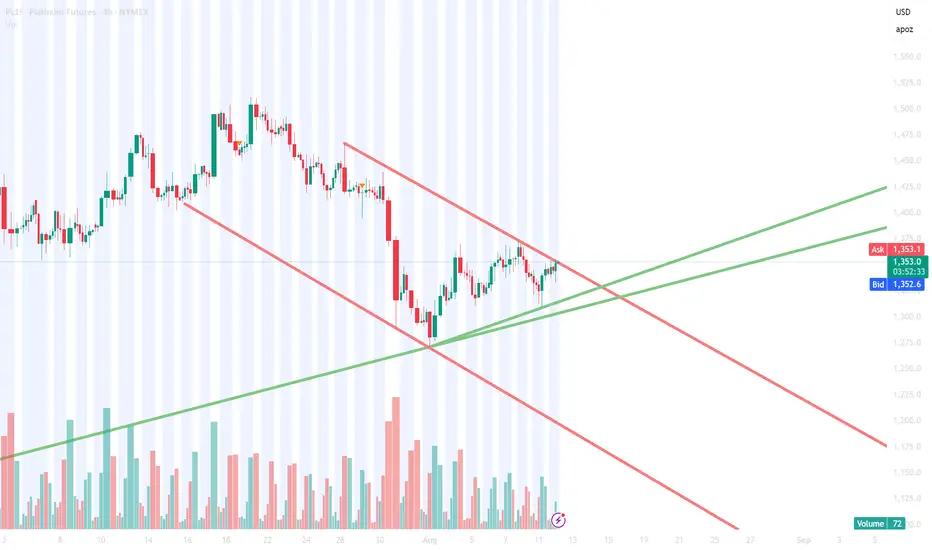
Channel formingBullisch channel is again forming. Long position for a breakout of the downtrend. keep an eye on the bottom for a bounce or a sprint to the upside in the coming days.
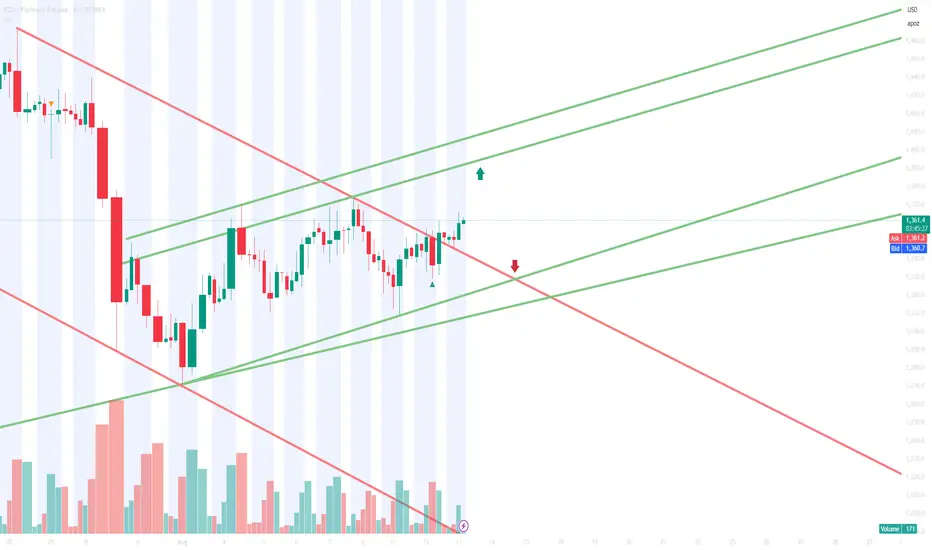
Looks like we are in a channel @PLQuick update on NYMEX:PL1! PL: The previous plan was to trade a break-out of the channel, which has now occurred. It looks like a new channel is forming. The current strategy is to either look for a breakout or simply trade the range within this new channel.
Upcoming trade in Platinum futuresNYMEX:PL1!
Platinum Futures chart is setting up for a potential trade. I'm watching closely for the first clear signals to go either long or short, as the price approaches key trendlines and resistance levels.

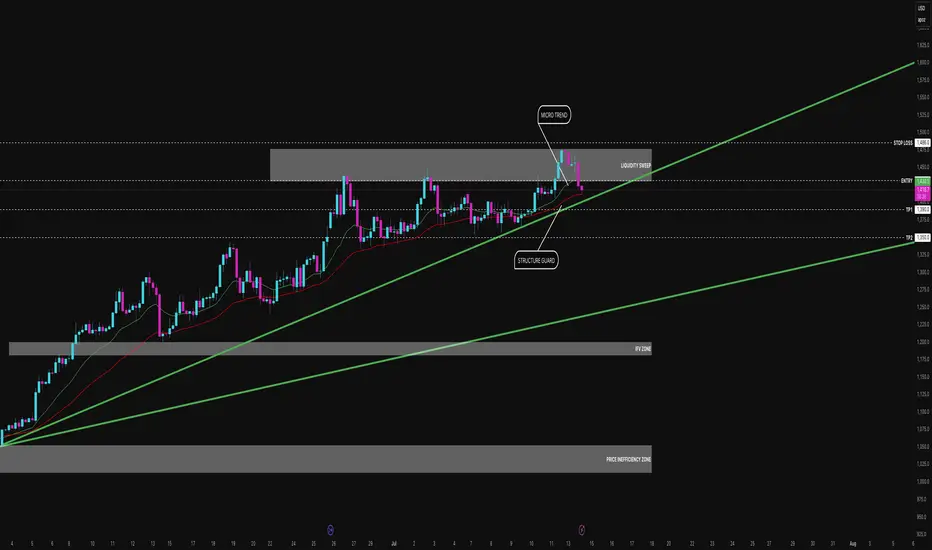
From Sweep to Slaughter, Bear Setup EngagedOk a little late but I saw this and thought I'd share. Price has swept liquidity above the prior range high and failed to close strong. Structure is now rejecting under micro trend EMAs, breaking the local trend line and forming a short-term bearish momentum bias into the IFV zone. This is a short-term bearish play following a liquidity sweep at key highs targeting rebalancing zones below while the broader uptrend remains intact.
Setup Breakdown:
Entry: 1440.3
SL: 1486.0
TP1: 1390.0
TP2: 1360.0
RRR: 2.3 (TP1) / 3.7 (TP2)
Confluence Stack:
Liquidity Sweep confirmed rejection from upper QPOI (1450–1480). Breaker Block Formed, post-sweep, price lost momentum and slipped below Micro Trend (EMA9). The Structure Guard has broken the 21 EMA and diagonal trend line now acting as dynamic resistance. IFV Zone is unfilled there is a clean inefficiency still open below with a high-probability magnet zone. Defined invalidation above swept highs, preserving capital integrity
Labels Used:
Liquidity Sweep – Engineered exit at top-side trap
Micro Trend – 9EMA, broken with momentum
Structure Guard – 21EMA + trend line intersection, acting as a flip zone
IFV Zone – Target area for rebalancing and fair value return
Price Inefficiency Zone – Swing support for a extreme retest
This setup aligns with typical post-sweep reversal behaviour seen in thin commodity books. Short into structure with clearly defined risk, targeting the inefficiencies below. If TP1 breaks cleanly, runners to TP2 offer major extension potential into institutional rebalance levels.
What I'm Watching:
EMA resistance holding = active setup
Daily close below 1390 = continuation confirmation
Aggressive shorts could trail stop once 1410 is lost intraday
Staakd Rating:
Edge: ★★★★☆
Risk Profile: Moderate
Setup Type: Liquidity Reversal > IFV Rebalancing
Running this short? Scaling in from lower TFs? Let’s compare triggers drop your setups.
How much higher for Platinum futures In this video I look at the current price of platinum on a higher tf and forecast where I believe the cool down to this rally might begin.
Using tools like the fib extension, volume profile and speed fan we are able to highlight a major reaction zone ahead at $1600 region .
Set alerts at these key levels for what might prove to be a solid short entry or a rejection , retest and claim for higher levels like the 1.618 ext .


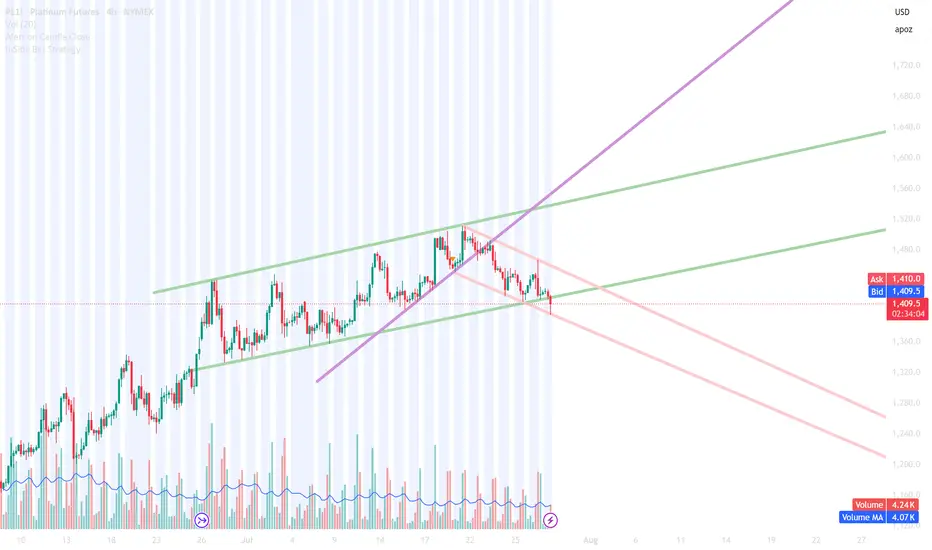
PL to 1200 Platinum has made a massive upwards move in the last 2 weeks. It has not tested my original $1400 price target but got pretty close. The large upwards move has formed a beautiful trend line with more than 3 touch points which has now been broken. I am looking for price to fall back to $1200 price level in the short term.
In the long term its possible to see $1400 I won't be looking for that unless is breaks this new downwards trend forming.

Platinum resistance - shortPlatinum is approaching a key area of support turned resistance. I would expect a turn around in this area, but please do whatever you think before trading on my advice only.

Platinum for a short?after a bullish run, the fundamentals on platinum have shifted sharply into bearish bias, aligning perfectly with a key weekly supply zone. The recent weekly rejection candle confirms seller presence and validates the zone.

Platinum Market Alert: One-Day Reversal in Play On Friday, the platinum market printed a key day reversal — a classic signal that a short-term correction may be underway.
🔍 In our analysis posted Thursday, we highlighted the 55-hour moving average as good place to place a stop level in a runaway market. Fast forward to now: that level has been decisively broken, along with a drop below the cloud on the hourly chart.
⚠️ This breakdown increases the probability of a near-term correction.
Stay sharp. Manage your risk. Markets are talking — hope that you are listening!
Disclaimer:
The information posted on Trading View is for informative purposes and is not intended to constitute advice in any form, including but not limited to investment, accounting, tax, legal or regulatory advice. The information therefore has no regard to the specific investment objectives, financial situation or particular needs of any specific recipient. Opinions expressed are our current opinions as of the date appearing on Trading View only. All illustrations, forecasts or hypothetical data are for illustrative purposes only. The Society of Technical Analysts Ltd does not make representation that the information provided is appropriate for use in all jurisdictions or by all Investors or other potential Investors. Parties are therefore responsible for compliance with applicable local laws and regulations. The Society of Technical Analysts will not be held liable for any loss or damage resulting directly or indirectly from the use of any information on this site.

"Runaway Market? Here’s Where to Put Your Stop"Today we’re diving into what to do with your stops in a runaway market 🚀📈
Just 4 days ago, we talked about the platinum market breaking higher — and wow, what a move it’s made since then. So, the big question is:
👉 Where do you place your stops now?
Here’s my approach:
🔍 First, I check the long-term time frame. We're heading toward 1348 — that’s the 2021 high, and likely a profit-taking level.
📉 Then I drop into shorter time frames — hourly, 30-min, 15-min, even 5-min if needed.
I’m currently eyeing the hourly chart, where the 55-hour moving average (green line) has done a solid job supporting the rally. It's sitting at 1227 — a reasonable area to consider for a stop, especially with little other support nearby.
Hope this helps!
Disclaimer:
The information posted on Trading View is for informative purposes and is not intended to constitute advice in any form, including but not limited to investment, accounting, tax, legal or regulatory advice. The information therefore has no regard to the specific investment objectives, financial situation or particular needs of any specific recipient. Opinions expressed are our current opinions as of the date appearing on Trading View only. All illustrations, forecasts or hypothetical data are for illustrative purposes only. The Society of Technical Analysts Ltd does not make representation that the information provided is appropriate for use in all jurisdictions or by all Investors or other potential Investors. Parties are therefore responsible for compliance with applicable local laws and regulations. The Society of Technical Analysts will not be held liable for any loss or damage resulting directly or indirectly from the use of any information on this site.

Just in Case Still Believe that Silver Will Outperfom Platinum..Platinum is still severely undervalues when compared to both Gold and Silver...If you still think Silver will move as much as Platinum in this Bull market, there is a very high probability that you will be wrong...most people think that Silver will outperform...and most people are always wrong...only a small percentage of people are right...and they will have a lot of wealth...there are more poor people than wealthy...that is how the world works...You are being brainwashed.

Platinum Futures Break Major Long-Term Down trendsToday, we're analysing Platinum Futures – and the market is showing some major technical shifts. On the weekly chart, we’ve seen a sharp rise, pushing prices to new 3-year highs.
Switching to the monthly chart, the picture gets even more compelling:
🔹 We've broken above two significant long-term downtrends — one dating back to 2008, and another from 2011.
🔹 The price has now hit the 200-month moving average at 1155. A close above this level could confirm a powerful breakout.
🔹 The measured upside target? A potential move to 1826, based on the 2020–2021 range.
In the short-to-medium term, keep an eye on these levels:
✅ Resistance at 1100 and 1348 (Feb 2021 high)
🛡️ Support ideally holds above 1081–1045 to maintain bullish momentum
📊 This is shaping up to be an exciting market with long-term potential.
Disclaimer:
The information posted on Trading View is for informative purposes and is not intended to constitute advice in any form, including but not limited to investment, accounting, tax, legal or regulatory advice. The information therefore has no regard to the specific investment objectives, financial situation or particular needs of any specific recipient. Opinions expressed are our current opinions as of the date appearing on Trading View only. All illustrations, forecasts or hypothetical data are for illustrative purposes only. The Society of Technical Analysts Ltd does not make representation that the information provided is appropriate for use in all jurisdictions or by all Investors or other potential Investors. Parties are therefore responsible for compliance with applicable local laws and regulations. The Society of Technical Analysts will not be held liable for any loss or damage resulting directly or indirectly from the use of any information on this site.

I cant believe Platinum is still this cheap vs goldPlatinum could hit its all-time high of ~$2,400/oz in 5-10 years if things line up. South Africa’s mines are struggling, so supply is tight. Demand is growing for platinum in green hydrogen tech and car parts, especially with big global investments. Plus, with U.S. debt soaring and the dollar looking shaky, people might turn to platinum like they do gold and silver to protect their money. If electric vehicles don’t cut demand too much and the economy stays decent, platinum could soar to $2,400 by 2030-2035.
Im long a bunch, and will sell portion along the way up to get my basis out and ride the rest for free.
Like if you agree!

Platinum to $1400? Platinum has broken out of a multi year downwards trend line accompanied by a large spike volume. It was consolidating for a couple months before the most recent move up and now we are consolidating again. Right now it is holding above the previous high of the last consolidation and I believe it is prime for takeoff to prices not seen since 2022. If price breaks back below the green safety line reconsider strategy but as it stands I am still bullish. Given all the tariff whipsawing and Trump wanting to impose a 31% tariff on South Africa (where the largest amount of platinum comes from) in conjunction with the MAGA plan of bringing car manufacturing back to the states. Platinum is bound to have higher demand to be used in catalytic converters.

Weak DXY Will Not Let Metals Correct! - Metals AnalysisWeak DXY is giving gold a hard time o make a final flushout before 3950-4350

Current ideas for platinum Just some thoughts. Seems like more consolidation then it’ll likely drop a lot due to a strong fvg. Good luck traders

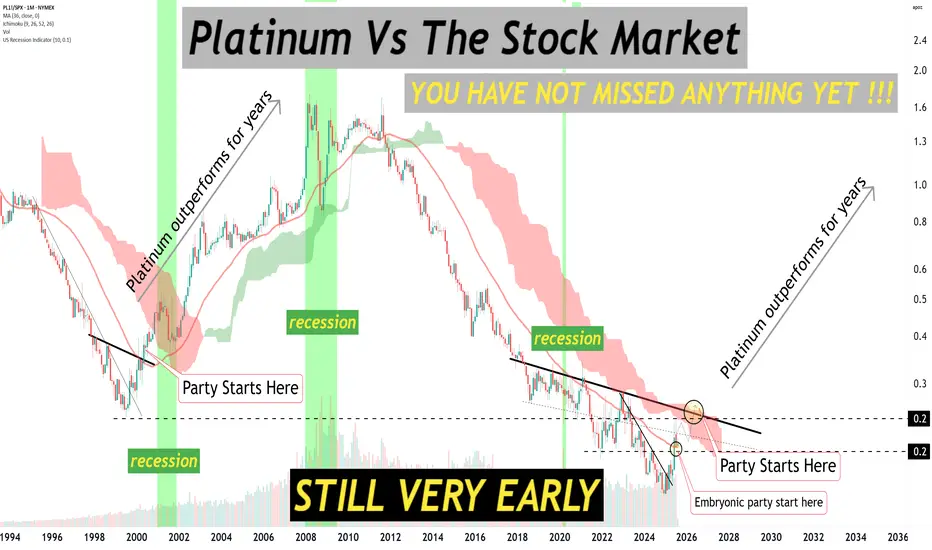
How can I be late to the platinum bull era?How can I be late to the platinum bull era when the party hasn’t even started?
The rocket-ship moments for platinum lie ahead—not behind us.
There’s no need to front-run anything.
No pressure. No rush. Just readiness.
Wait.. where did I read something similar before... again!