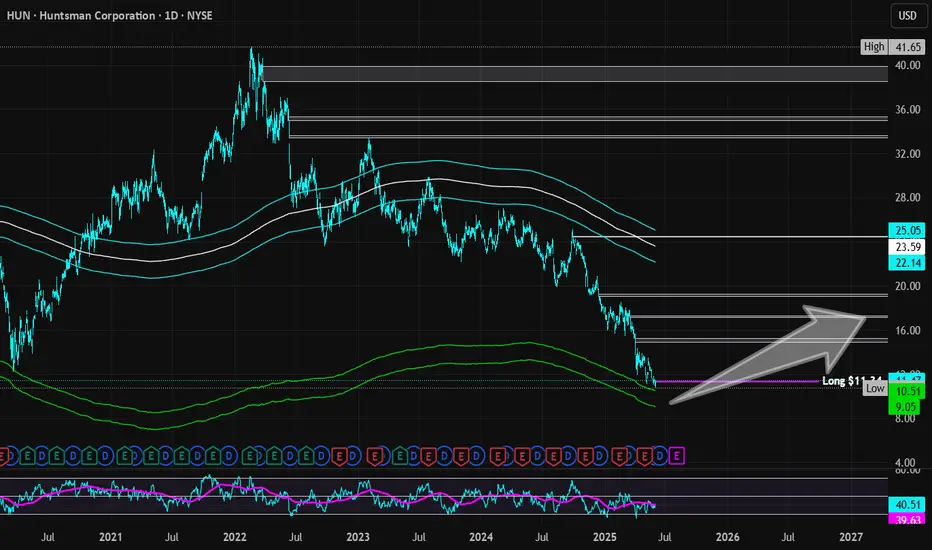
Huntsman Corporation | HUN | Long at $11.34The stock price for Huntsman Corp NYSE:HUN , a manufacturer of organic chemical products, has dropped significantly since its peak in 2022 ($41.65). This was due to lower sales volumes, weak demand in construction and transportation, higher input costs, and European operational challenges, includi
Next report date
—
Report period
—
EPS estimate
—
Revenue estimate
—
−1.80 USD
−162.00 M USD
6.04 B USD
163.70 M
About Huntsman Corporation
Sector
Industry
CEO
Peter R. Huntsman
Website
Headquarters
The Woodlands
Founded
1970
FIGI
BBG000NS26Q8
Huntsman Corp. engages in the manufacturing of differentiated organic chemical products. It operates through the following segments: Polyurethanes, Performance Products, and Advanced Materials. The Polyurethanes segment manufactures and markets polyurethane chemicals, including MDI products, PO, polyols, PG, TPU, aniline, and MTBE. The Performance Products segment produces and sells amines, surfactants, LAB, and maleic anhydride to a variety of consumer and industrial end markets. The Advanced Materials segment provides basic liquid and solid epoxy resins, specialty resin compounds, cross linking, matting and curing agents, epoxy, acrylic, and polyurethane based polymer products. The company was founded by Jon Meade Huntsman Sr. in 1970 and is headquartered in The Woodlands, TX.
Related stocks
$HUNPotential "abc zigzag" located after a recent 5 wave to the downside. This abc zig zag could be in the middle of another 5 wave downtred. Regardless, I'm looking for a retracement leg at this location where we just broke a recent support and if this is an abc zigzag within this wave 3 to the downsid

Topping Pattern Example (Head and Shoulders)Hunstman is a chemical manufacturer whose earnings have plummeted over 85% compared to the first half of 2022. The chart is a prime example of a large head & shoulders pattern. Analysts expect its earning to remain depressed and the chart shows signs of Distribution over the past 2 years.

Huntsman (HUN) - Head and Shoulders?Possible Head and Shoulders pattern with Neckline @ $24. A break would give readable targets @~ $14ish. This also coincides with trend channel.

Huntsman Squeezes at Potentially Key LevelChemical maker Huntsman might not be the kind of stock traders often watch, but it has some potentially interesting chart patterns.
First is the level around $33.50, near the highs in November. Prices have been holding it in recent weeks as the broader market tumbled. Is old resistance becoming new


Huntman Corporation USA Sun Storm Investment Trading Desk & NexGen Wealth Management Service Present's: SSITD & NexGen Portfolio of the Week Series
Focus: Worldwide
By Sun Storm Investment Research & NexGen Wealth Management Service
A Profit & Solutions Strategy & Research
Trading | Investment | Stocks | ETF | Mutua

HUN New All Time HighsHuntsman Corp (HUN) made a New All Time High and closed above it
Breakout of 2 Year Long Base
Well defined risk reward
Price well above 200 DMA
Above average volume


See all ideas
Summarizing what the indicators are suggesting.
Neutral
SellBuy
Strong sellStrong buy
Strong sellSellNeutralBuyStrong buy
Neutral
SellBuy
Strong sellStrong buy
Strong sellSellNeutralBuyStrong buy
Neutral
SellBuy
Strong sellStrong buy
Strong sellSellNeutralBuyStrong buy
An aggregate view of professional's ratings.
Neutral
SellBuy
Strong sellStrong buy
Strong sellSellNeutralBuyStrong buy
Neutral
SellBuy
Strong sellStrong buy
Strong sellSellNeutralBuyStrong buy
Neutral
SellBuy
Strong sellStrong buy
Strong sellSellNeutralBuyStrong buy
Displays a symbol's price movements over previous years to identify recurring trends.
HUN5901239
Huntsman International LLC 5.7% 15-OCT-2034Yield to maturity
7.14%
Maturity date
Oct 15, 2034
HUN5191101
Huntsman International LLC 2.95% 15-JUN-2031Yield to maturity
6.71%
Maturity date
Jun 15, 2031
HUN4804232
Huntsman International LLC 4.5% 01-MAY-2029Yield to maturity
6.09%
Maturity date
May 1, 2029
See all HUN bonds
Frequently Asked Questions
The current price of HUN is 9.46 USD — it has decreased by −0.42% in the past 24 hours. Watch Huntsman Corporation stock price performance more closely on the chart.
Depending on the exchange, the stock ticker may vary. For instance, on NYSE exchange Huntsman Corporation stocks are traded under the ticker HUN.
HUN stock has fallen by −3.57% compared to the previous week, the month change is a −16.73% fall, over the last year Huntsman Corporation has showed a −53.74% decrease.
We've gathered analysts' opinions on Huntsman Corporation future price: according to them, HUN price has a max estimate of 20.00 USD and a min estimate of 9.00 USD. Watch HUN chart and read a more detailed Huntsman Corporation stock forecast: see what analysts think of Huntsman Corporation and suggest that you do with its stocks.
HUN stock is 2.36% volatile and has beta coefficient of 1.02. Track Huntsman Corporation stock price on the chart and check out the list of the most volatile stocks — is Huntsman Corporation there?
Today Huntsman Corporation has the market capitalization of 1.65 B, it has decreased by −4.88% over the last week.
Yes, you can track Huntsman Corporation financials in yearly and quarterly reports right on TradingView.
Huntsman Corporation is going to release the next earnings report on Oct 30, 2025. Keep track of upcoming events with our Earnings Calendar.
HUN earnings for the last quarter are −0.20 USD per share, whereas the estimation was −0.13 USD resulting in a −58.85% surprise. The estimated earnings for the next quarter are −0.14 USD per share. See more details about Huntsman Corporation earnings.
Huntsman Corporation revenue for the last quarter amounts to 1.46 B USD, despite the estimated figure of 1.49 B USD. In the next quarter, revenue is expected to reach 1.47 B USD.
HUN net income for the last quarter is −159.00 M USD, while the quarter before that showed −4.00 M USD of net income which accounts for −3.88 K% change. Track more Huntsman Corporation financial stats to get the full picture.
Yes, HUN dividends are paid quarterly. The last dividend per share was 0.25 USD. As of today, Dividend Yield (TTM)% is 10.53%. Tracking Huntsman Corporation dividends might help you take more informed decisions.
As of Aug 9, 2025, the company has 6.3 K employees. See our rating of the largest employees — is Huntsman Corporation on this list?
EBITDA measures a company's operating performance, its growth signifies an improvement in the efficiency of a company. Huntsman Corporation EBITDA is 324.00 M USD, and current EBITDA margin is 6.01%. See more stats in Huntsman Corporation financial statements.
Like other stocks, HUN shares are traded on stock exchanges, e.g. Nasdaq, Nyse, Euronext, and the easiest way to buy them is through an online stock broker. To do this, you need to open an account and follow a broker's procedures, then start trading. You can trade Huntsman Corporation stock right from TradingView charts — choose your broker and connect to your account.
Investing in stocks requires a comprehensive research: you should carefully study all the available data, e.g. company's financials, related news, and its technical analysis. So Huntsman Corporation technincal analysis shows the sell today, and its 1 week rating is sell. Since market conditions are prone to changes, it's worth looking a bit further into the future — according to the 1 month rating Huntsman Corporation stock shows the sell signal. See more of Huntsman Corporation technicals for a more comprehensive analysis.
If you're still not sure, try looking for inspiration in our curated watchlists.
If you're still not sure, try looking for inspiration in our curated watchlists.