IONQ Reversal Setup — Breakout Above Downtrend Channel!
📝 Full Description (TradingView Post):
Ticker: NYSE:IONQ
Timeframe: 30-Min Chart
Trade Type: Long Reversal Setup
IONQ recently pulled back from a sharp rally and entered a consolidation phase, forming a descending trendline with horizontal support around the $39–$40 zone. Price is now showing s
Next report date
—
Report period
—
EPS estimate
—
Revenue estimate
—
−1.49 USD
−331.65 M USD
43.07 M USD
248.82 M
About IonQ, Inc.
Sector
Industry
CEO
Niccolo M. de Masi
Website
Headquarters
College Park
Founded
2015
FIGI
BBG00XZP0LB4
IonQ, Inc. develops and manufactures quantum computers. The firm specializes in quantum computing and quantum information processing. The company was founded by Christopher Monroe and Jung Sang Kim in 2015 and is headquartered in College Park, MD.

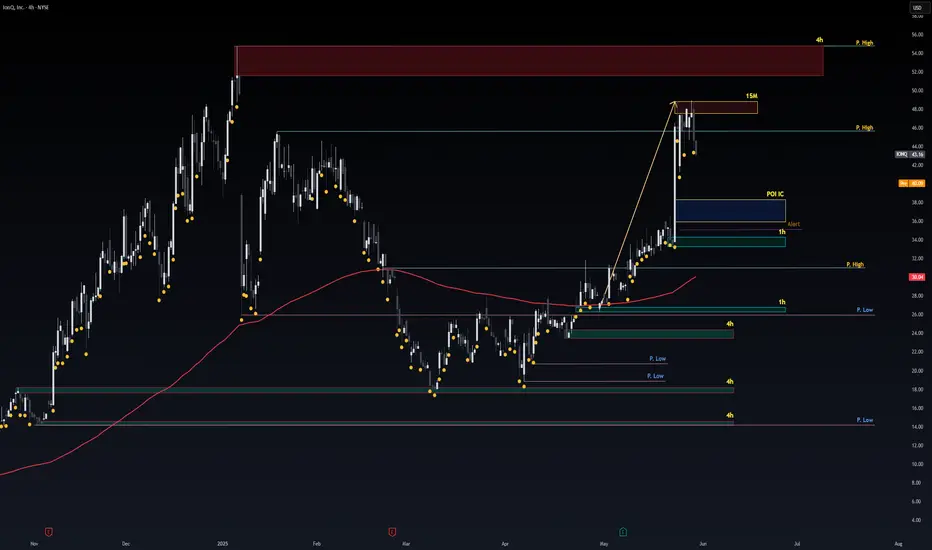
"Still Holding IONQ — $43.35 Is the Real Breakout""IONQ Hit My Target Twice — Now I’m Waiting for a $43.35 Breakout" @Gerrie77

Safe Entry ZoneStock Pre-market in Down Movement.
We have Three Main Support Fesh Zones acts as good support for IONQ:
1- The Blue POI IC (Point Of Interesting or Institutional Candle) acts as support level which is interest zone for price to re-test @ 38-36 price level.
2- The 1h Green Zone @ 33-34 Price level
IONQ - Is quantum computing worth investing for future?Hello Team,
Do you think Quatum Computer Stocks makes you Millioner :)
I will Publish some analysis for some Quantum Computer stocks today.
First one is IONQ:
All Quantum stocks are still so volatile but i see really good opportunities in daily bases for both side (Long / Short).
But i will mak

IONQ CEO sells ALL shares owned by his private inv firm.Breaking BEFORE the news play: IONQ CEO sells ENTIRE stock position from founding stock for 100mil.
2597500 shares to be sold on June 11, 2025 (approx date of sale) for $103,224,650.
www.sec.gov
This is a pre-news coverage play in a hyped sector.
Following trading rules
1. NEWS - its not hit t

IONQ targets for the ongoing upward rallyIONQ still has to deliver more than 25% growth in its ongoing upward rally. A good price to sell the stock would be at $61.7.
The next targets would only be activated if the price breaks through the $69.39 resistance line ⏳

IONQ – Quantum Computing Breakout Setup | 36.62% UpsideIONQ (NYSE: IONQ) just printed a strong bullish continuation pattern with a clean break above cloud resistance and key pivot zones. The price is holding above $31.50 and is now coiled just under the recent high—setting up a powerful breakout opportunity.
🔍 Technical Breakdown:
✅ Price well above th

IONQ - Possibility of a final phase wave C CorrectionIONQ seem to be starting final phase (Wave C) of downward correction. Breaking today's high would invalidate this wave C scenario as it's already extended a lot. Closing within the channel during this week would be preferable for this scenario. Wave C should take us to the red box.
Note: This is my

IONQ - Possibility of a final phase wave C Correction IONQ seem to be starting final phase (Wave C) of downward correction. Breaking today's high would invalidate this wave C scenario as it's already extended a lot. Closing within the channel during this week would be preferable for this scenario. Wave C should take us to the red box.
Note: This is m

IONQDo you guys know where your targets are? If you need help, we can discuss. Looks like it's about to fire off.

See all ideas
Summarizing what the indicators are suggesting.
Neutral
SellBuy
Strong sellStrong buy
Strong sellSellNeutralBuyStrong buy
Neutral
SellBuy
Strong sellStrong buy
Strong sellSellNeutralBuyStrong buy
Neutral
SellBuy
Strong sellStrong buy
Strong sellSellNeutralBuyStrong buy
An aggregate view of professional's ratings.
Neutral
SellBuy
Strong sellStrong buy
Strong sellSellNeutralBuyStrong buy
Neutral
SellBuy
Strong sellStrong buy
Strong sellSellNeutralBuyStrong buy
Neutral
SellBuy
Strong sellStrong buy
Strong sellSellNeutralBuyStrong buy
Displays a symbol's price movements over previous years to identify recurring trends.
Related stocks
Frequently Asked Questions
The current price of IONQ is 37.84 USD — it has decreased by −2.25% in the past 24 hours. Watch IonQ, Inc. stock price performance more closely on the chart.
Depending on the exchange, the stock ticker may vary. For instance, on NYSE exchange IonQ, Inc. stocks are traded under the ticker IONQ.
IONQ stock has risen by 0.45% compared to the previous week, the month change is a 12.28% rise, over the last year IonQ, Inc. has showed a 373.00% increase.
We've gathered analysts' opinions on IonQ, Inc. future price: according to them, IONQ price has a max estimate of 50.00 USD and a min estimate of 30.00 USD. Watch IONQ chart and read a more detailed IonQ, Inc. stock forecast: see what analysts think of IonQ, Inc. and suggest that you do with its stocks.
IONQ reached its all-time high on Jan 7, 2025 with the price of 54.74 USD, and its all-time low was 3.04 USD and was reached on Dec 28, 2022. View more price dynamics on IONQ chart.
See other stocks reaching their highest and lowest prices.
See other stocks reaching their highest and lowest prices.
IONQ stock is 6.38% volatile and has beta coefficient of 2.49. Track IonQ, Inc. stock price on the chart and check out the list of the most volatile stocks — is IonQ, Inc. there?
Today IonQ, Inc. has the market capitalization of 9.90 B, it has decreased by −5.45% over the last week.
Yes, you can track IonQ, Inc. financials in yearly and quarterly reports right on TradingView.
IonQ, Inc. is going to release the next earnings report on Aug 7, 2025. Keep track of upcoming events with our Earnings Calendar.
IONQ earnings for the last quarter are −0.14 USD per share, whereas the estimation was −0.26 USD resulting in a 46.15% surprise. The estimated earnings for the next quarter are −0.32 USD per share. See more details about IonQ, Inc. earnings.
IonQ, Inc. revenue for the last quarter amounts to 7.57 M USD, despite the estimated figure of 7.51 M USD. In the next quarter, revenue is expected to reach 17.23 M USD.
IONQ net income for the last quarter is −32.25 M USD, while the quarter before that showed −202.00 M USD of net income which accounts for 84.03% change. Track more IonQ, Inc. financial stats to get the full picture.
No, IONQ doesn't pay any dividends to its shareholders. But don't worry, we've prepared a list of high-dividend stocks for you.
As of Jun 15, 2025, the company has 407 employees. See our rating of the largest employees — is IonQ, Inc. on this list?
EBITDA measures a company's operating performance, its growth signifies an improvement in the efficiency of a company. IonQ, Inc. EBITDA is −232.50 M USD, and current EBITDA margin is −492.89%. See more stats in IonQ, Inc. financial statements.
Like other stocks, IONQ shares are traded on stock exchanges, e.g. Nasdaq, Nyse, Euronext, and the easiest way to buy them is through an online stock broker. To do this, you need to open an account and follow a broker's procedures, then start trading. You can trade IonQ, Inc. stock right from TradingView charts — choose your broker and connect to your account.
Investing in stocks requires a comprehensive research: you should carefully study all the available data, e.g. company's financials, related news, and its technical analysis. So IonQ, Inc. technincal analysis shows the neutral today, and its 1 week rating is strong buy. Since market conditions are prone to changes, it's worth looking a bit further into the future — according to the 1 month rating IonQ, Inc. stock shows the buy signal. See more of IonQ, Inc. technicals for a more comprehensive analysis.
If you're still not sure, try looking for inspiration in our curated watchlists.
If you're still not sure, try looking for inspiration in our curated watchlists.