NUS Pullback Breakout – Next Stop: $10.50?!""
📊 Trade Setup Summary:
Ticker: NUS (NYSE)
Pattern: Pullback breakout after bull flag / wedge
Entry: $8.63 (break above yellow line)
Stop Loss: $8.05 (white support zone)
Target Zones:
TP1: $9.35 (red resistance)
TP2: $10.50 (green target)
Risk/Reward: Roughly 1:2+
Volume: Increasing near
Next report date
—
Report period
—
EPS estimate
—
Revenue estimate
—
−0.78 USD
−146.59 M USD
1.73 B USD
47.46 M
About Nu Skin Enterprises, Inc.
Sector
Industry
CEO
Ryan S. Napierski
Website
Headquarters
Provo
Founded
1984
FIGI
BBG000HG21Y3
Nu Skin Enterprises, Inc. is a holding company, which engages in the development and distribution of beauty and wellness solutions. It operates through the following segments: Mainland China, Americas, South Korea, Southeast Asia/Pacific, EMEA, Japan, Hong Kong/Taiwan, Nu Skin Other, Manufacturing, and Rhyz Other. The company was founded by Blake M. Roney, Sandra N. Tillotson, and Steven J. Lund in 1984 and is headquartered in Provo, UT.
Related stocks

Incoming 200% gain for Nu Skin Enterprises ??On the above 6 day chart price action has corrected 80% since January 2021. A number of reasons now exist for a long position.
1) Price action and RSI resistance breakouts.
2) Regular bullish divergence.
3) Support and resistance. Look left. Price action is on legacy support. See monthly chart be

NU SKIN Stock Chart Fibonacci Analysis 012324Trading Idea
1) Find a FIBO slingshot
2) Check FIBO 61.80% level
3) Entry Point > 18/61.80%
Chart time frame : B
A) 15 min(1W-3M)
B) 1 hr(3M-6M)
C) 4 hr(6M-1year)
D) 1 day(1-3years)
Stock progress : A
A) Keep rising over 61.80% resistance
B) 61.80% resistance
C) Hit the bottom
D) Hit the top
S

Trading Idea - #NuSkinMy trading idea for - Nu Skin - BUY based on strong seasonality!
Entry: 40.00 USD
Target: 44.00 USD (+10% profit)
Nu Skin Enterprises is a direct sales company for health and beauty products.
I am buying a position in Nu Skin because of its strong seasonality.
In the period May to early August,

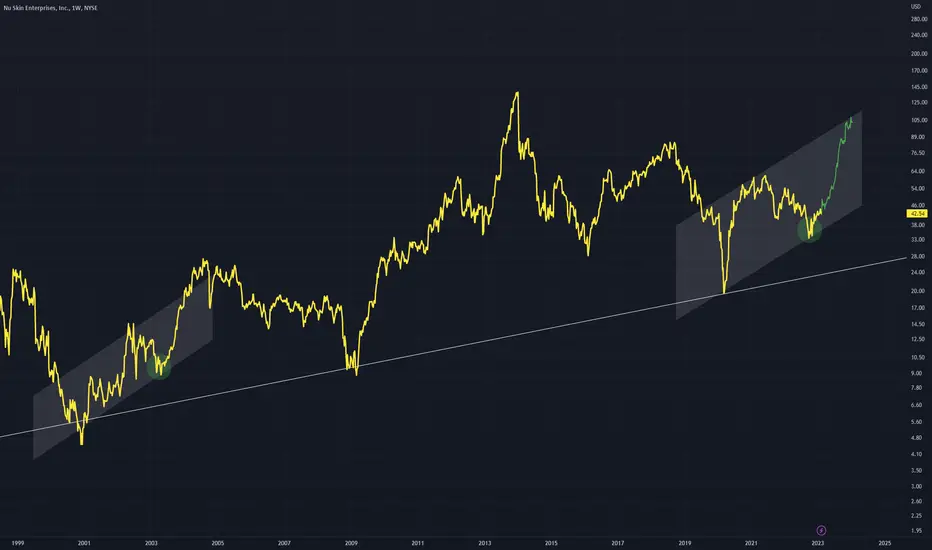
NUS - Comparing Two Channels Similar channels can be seen on chart
Similar points also can be seen in green circles
Using this comparison we can expect a rise coming on the latest channel.
Bullish above the dominant trend line in white.
NUS could be bearish and fast if break downTHE CONSISTENT TRADES analyze EL as a bearish /weak fundamental stock and therefore would be traded only in a short position.
NUS is in a triangle and is close to all major MA which could be an indication of a strong move soon. A breakdown below the red dotted line would be triggered for a short po

NUS daily - inside in big rising wedge - bearishNUS daily - even though NUS is above BigRed (200 days MA) is close to a breakout of a big rising wenge which is a very bearish pattern.
Volume is neutral to bearish because this whole leg up is on volume below 20 days average volume.
At the moment NUS is above all major MA (8, 20, 50, and 200) whi

NU skin enterprises nasdaq long position bullish indication
higher high higher low
green candles
crossed resistance level
head and shoulder chart pattern
plan
buy 49.46
stoploss 46.58
tp1 52.01
tp2 54.12

Head and Shoulders pattern on NUSSo far I see a decent H&S Pattern on Symbol NUS so it could be a great opportunity for a trend reversal. Not Financial advise just my opinion Trade at your own risk. I will update this as it develops and hopefully continues in bullish pattern. Please feel free to comment and share Ideas.

NUS LONG USING PVSRA - ANALYSIS BOTH D AND W CHARTSI used PVSRA to spot the accumulation (see the colored candles) with notable volume that you can see at the volume bar.
I see a great chance for this stock to go up until the next earnings announcement.
It is going long the trend line very well on the weekly chart too.
NUS (weekly)
EP = 48.84
ATR

See all ideas
Summarizing what the indicators are suggesting.
Oscillators
Neutral
SellBuy
Strong sellStrong buy
Strong sellSellNeutralBuyStrong buy
Oscillators
Neutral
SellBuy
Strong sellStrong buy
Strong sellSellNeutralBuyStrong buy
Summary
Neutral
SellBuy
Strong sellStrong buy
Strong sellSellNeutralBuyStrong buy
Summary
Neutral
SellBuy
Strong sellStrong buy
Strong sellSellNeutralBuyStrong buy
Summary
Neutral
SellBuy
Strong sellStrong buy
Strong sellSellNeutralBuyStrong buy
Moving Averages
Neutral
SellBuy
Strong sellStrong buy
Strong sellSellNeutralBuyStrong buy
Moving Averages
Neutral
SellBuy
Strong sellStrong buy
Strong sellSellNeutralBuyStrong buy
Displays a symbol's price movements over previous years to identify recurring trends.
Curated watchlists where NUS is featured.

Frequently Asked Questions
The current price of NUS is 7.72 USD — it has increased by 0.52% in the past 24 hours. Watch Nu Skin Enterprises, Inc. stock price performance more closely on the chart.
Depending on the exchange, the stock ticker may vary. For instance, on NYSE exchange Nu Skin Enterprises, Inc. stocks are traded under the ticker NUS.
NUS stock has fallen by −1.66% compared to the previous week, the month change is a 3.35% rise, over the last year Nu Skin Enterprises, Inc. has showed a −35.67% decrease.
NUS stock is 4.01% volatile and has beta coefficient of 1.03. Track Nu Skin Enterprises, Inc. stock price on the chart and check out the list of the most volatile stocks — is Nu Skin Enterprises, Inc. there?
Today Nu Skin Enterprises, Inc. has the market capitalization of 379.49 M, it has decreased by −3.88% over the last week.
Yes, you can track Nu Skin Enterprises, Inc. financials in yearly and quarterly reports right on TradingView.
Nu Skin Enterprises, Inc. is going to release the next earnings report on Jul 30, 2025. Keep track of upcoming events with our Earnings Calendar.
NUS earnings for the last quarter are 0.23 USD per share, whereas the estimation was 0.13 USD resulting in a 75.57% surprise. The estimated earnings for the next quarter are 0.24 USD per share. See more details about Nu Skin Enterprises, Inc. earnings.
Nu Skin Enterprises, Inc. revenue for the last quarter amounts to 364.49 M USD, despite the estimated figure of 352.06 M USD. In the next quarter, revenue is expected to reach 376.67 M USD.
NUS net income for the last quarter is 107.52 M USD, while the quarter before that showed −36.10 M USD of net income which accounts for 397.78% change. Track more Nu Skin Enterprises, Inc. financial stats to get the full picture.
Yes, NUS dividends are paid quarterly. The last dividend per share was 0.06 USD. As of today, Dividend Yield (TTM)% is 3.13%. Tracking Nu Skin Enterprises, Inc. dividends might help you take more informed decisions.
As of Jun 21, 2025, the company has 11.3 K employees. See our rating of the largest employees — is Nu Skin Enterprises, Inc. on this list?
EBITDA measures a company's operating performance, its growth signifies an improvement in the efficiency of a company. Nu Skin Enterprises, Inc. EBITDA is 115.61 M USD, and current EBITDA margin is 6.96%. See more stats in Nu Skin Enterprises, Inc. financial statements.
Like other stocks, NUS shares are traded on stock exchanges, e.g. Nasdaq, Nyse, Euronext, and the easiest way to buy them is through an online stock broker. To do this, you need to open an account and follow a broker's procedures, then start trading. You can trade Nu Skin Enterprises, Inc. stock right from TradingView charts — choose your broker and connect to your account.
Investing in stocks requires a comprehensive research: you should carefully study all the available data, e.g. company's financials, related news, and its technical analysis. So Nu Skin Enterprises, Inc. technincal analysis shows the neutral today, and its 1 week rating is buy. Since market conditions are prone to changes, it's worth looking a bit further into the future — according to the 1 month rating Nu Skin Enterprises, Inc. stock shows the sell signal. See more of Nu Skin Enterprises, Inc. technicals for a more comprehensive analysis.
If you're still not sure, try looking for inspiration in our curated watchlists.
If you're still not sure, try looking for inspiration in our curated watchlists.