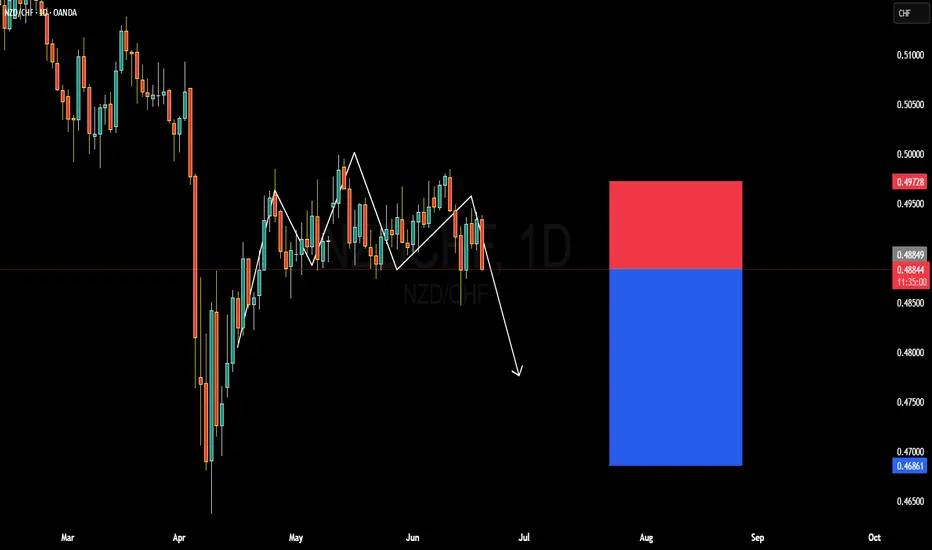
NZDCHF BULLISH OR BEARISH DETAILED ANALYSISNZDCHF is currently trading around the 0.4880–0.4900 zone, and on the daily timeframe, the pair appears to be completing an inverse head and shoulders pattern. However, unlike the typical bullish nature of this pattern, price has failed to break above the neckline and is showing early signs of beari
Related currencies

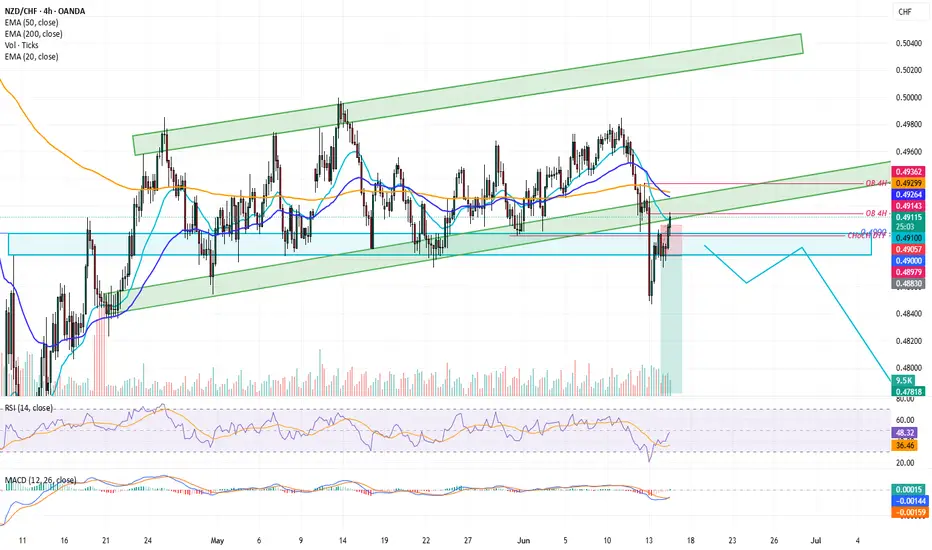
NZDCHF Analysis – “Kiwi Faces Uphill Battle Against Safe-Haven FNZDCHF Price has formed a bearish pennant / triangle after a strong drop from the highs around 0.4960.
Rejection seen from the trendline resistance at ~0.4900, suggesting limited bullish momentum.
Bearish targets are mapped to:
0.4847 (first support)
0.4819 (deeper bearish target)
Two bearish s

POSSIBLE SELL OPPORTUNITY ON NZDCHFPrice continues to fall on the NZDCHF pair. We have a quality supply zone formed above the on featured here. Price keeps on forming new supply zones giving us multiple opportunities to enter the trade.

SELL NZDCHFNZDCHF displays a bearish pennant. Sell now at 0,4935
Take Profit 0,49012
Stop Loss 0,49311

NZDCHF Swing Long – Double Bottom into Risk-On Revival🟢 LONG NZDCHF @ 0.48923 (Swing Position)
✅ Catalyst: Double bottom + RSI divergence + break above descending channel on 4H.
🛑 SL: 0.48469
🎯 TP1: 0.49565 (1:1.2 R:R)
🎯 TP2: 0.50230 (1:2.5 R:R)
🎯 TP3: 0.50800 (1:3.9 R:R)
📊 Chart: Price defended 0.4870 key structure zone. Bullish engulfing + EMA cr

NZDCHFTemporary sells on NZDCHF should follow after price tests the resistance trend line. It seems as though price is rejecting in this area, look for sells towards 0.48888

NZDCHF - The Bears Are Back!Hello TradingView Family / Fellow Traders. This is Richard, also known as theSignalyst.
📈NZDCHF has been overall bearish trading within the falling channel marked in red, and it is currently retesting the upper bound of the channel.
Moreover, the green zone is a strong resistance.
🏹 Thus, the h

NZDCHF SELL SETUPWe have officially gotten a change of trend as proven by the transition from a sequence of higher highs and higher lows to a lower low and lower high. Stacked on top of this sequence is a pullback for a retest of a key level confirming our setup.

NZDCHF Trade IdeaAt 4Hr timeframe, the trend break the ascending channel and retesting it @0.4900 AOI. There is a possible valid order block @0.4920 area that the trend is heading to it. if the is any reaction with bearish candlestick pattern within the order block, then the trend will continue bearish. First target
See all ideas
Summarizing what the indicators are suggesting.
Oscillators
Neutral
SellBuy
Strong sellStrong buy
Strong sellSellNeutralBuyStrong buy
Oscillators
Neutral
SellBuy
Strong sellStrong buy
Strong sellSellNeutralBuyStrong buy
Summary
Neutral
SellBuy
Strong sellStrong buy
Strong sellSellNeutralBuyStrong buy
Summary
Neutral
SellBuy
Strong sellStrong buy
Strong sellSellNeutralBuyStrong buy
Summary
Neutral
SellBuy
Strong sellStrong buy
Strong sellSellNeutralBuyStrong buy
Moving Averages
Neutral
SellBuy
Strong sellStrong buy
Strong sellSellNeutralBuyStrong buy
Moving Averages
Neutral
SellBuy
Strong sellStrong buy
Strong sellSellNeutralBuyStrong buy
Displays a symbol's price movements over previous years to identify recurring trends.
Frequently Asked Questions
The current rate of NZDCHF is 0.48806 CHF — it has decreased by −0.37% in the past 24 hours. See more of NZDCHF rate dynamics on the detailed chart.
The value of the NZDCHF pair is quoted as 1 NZD per x CHF. For example, if the pair is trading at 1.50, it means it takes 1.5 CHF to buy 1 NZD.
The term volatility describes the risk related to the changes in an asset's value. NZDCHF has the volatility rating of 0.64%. Track all currencies' changes with our live Forex Heatmap and prepare for markets volatility.
The NZDCHF showed a −0.37% fall over the past week, the month change is a −0.41% fall, and over the last year it has decreased by −10.08%. Track live rate changes on the NZDCHF chart.
Learn how you can make money on rate changes in numerous trading ideas created by our community.
Learn how you can make money on rate changes in numerous trading ideas created by our community.
NZDCHF is a minor currency pair, i.e. a popular pair that is not associated with USD. Such pairs are also called cross currency pairs.
Currencies are usually traded through forex brokers — choose the one that suits your needs and go ahead. You can trade NZDCHF right from TradingView charts — just log in to you broker account. Check out the list of our integrated brokers and find the best one for your needs and strategy.
When deciding to buy or sell currency one should keep in mind many factors including current geopolitical situation, interest rates, and other. But before plunging into a deep research, you can start with NZDCHF technical analysis. The technical rating for the pair is strong sell today, but don't forget that markets can be very unstable, so don't stop here. According to our 1 week rating the NZDCHF shows the strong sell signal, and 1 month rating is sell. See more of NZDCHF technicals for a more comprehensive analysis.