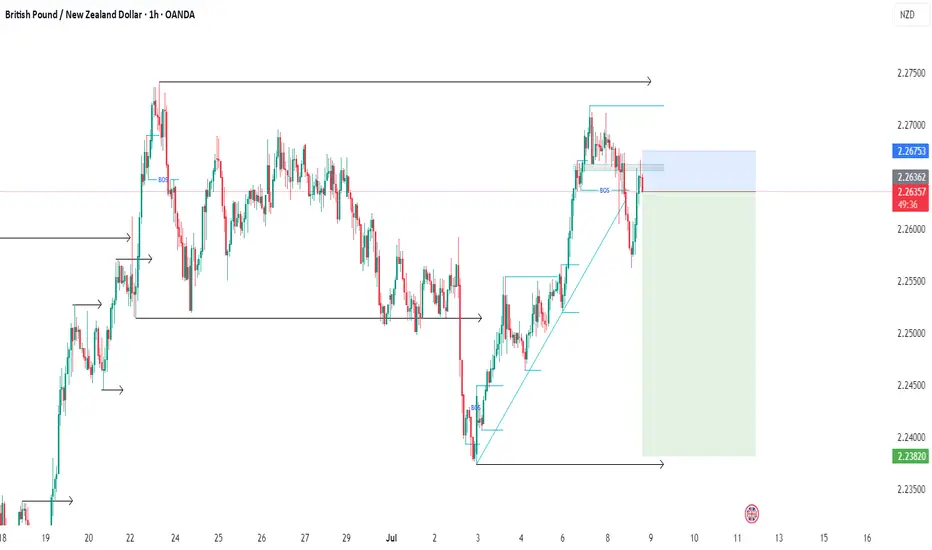
Lingrid | GBPNZD Trend Continuation OpportunityThe price perfectly fulfilled my last idea . FX:GBPNZD is rebounding strongly after forming a Higher Low just above the key support at 2.2587, sustaining the bullish structure. The recent impulse leg broke out of the previous downward channel, and price is now stabilizing for a potential rally t
Related currencies

GBPNZD Ahead of RBNZ Rate DecisionGBPNZD Ahead of RBNZ Rate Decision
GBPNZD tested again an area that was also tested earlier at the beginning of March 2025
It can be seen that this zone has stopped the price several times in the past.
Tomorrow the market is expecting RBNZ rate decision. It's expected that RBNZ may keep rates un

GBPNZD: One More Pullback Trade I notice another potentially profitable pullback trade opportunity on 📉GBPNZD.
The price formed a double top pattern after testing a significant daily/intraday resistance and has broken through its neckline.
Currently, we are witnessing a retest, and the pair could pull back to the 2.2391 level.

GBPNZD CUP and handle PatternGBPNZD is currently trading within a range-bound structure. The price was recently rejected from the resistance area near 2.2700, but found strong support at the 0.618 Fibonacci retracement level, indicating bullish interest at lower levels.
The pair has now formed a cup and handle pattern—typicall

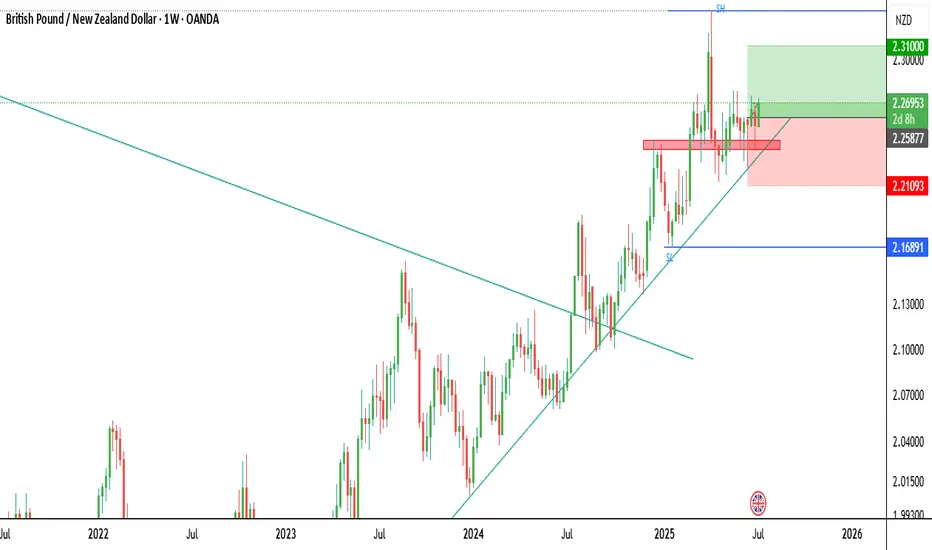
GBPNZD CONTINUING THE UPTREND?Looking at the last week rejection off the previous swing high, i think the GBPNZD will move upwards or continue this uptrend up until atleast the level 2.30873. A by considering the previous rejections on the swing high.
GBPNZD: Potential Reversal From The Resistance Zone-updateGBPNZD: Potential Reversal From The Resistance Zone-update
Based on our previous analysis, GBPNZD has retested 2.7000 and currently appears poised for a bearish movement.
GBPNZD tested an area that was also tested earlier at the beginning of March 2025
From the chart, we can see that this zone

GBPNZD to find buyers at current market price?GBPNZD - 24h expiry
The medium term bias remains bullish.
We look for a temporary move lower. Preferred trade is to buy on dips.
Bespoke support is located at 2.2485.
Risk/Reward is ample to buy at market.
We look to Buy at 2.2485 (stop at 2.2430)
Our profit targets will be 2.2705 and 2.2730

GBPNZD SELLWe have officially gotten a change of trend as proven by the transition from a sequence of higher highs and higher lows to a lower low and lower high. Stacked on top of this sequence is a pullback for a retest of a key level confirming our setup.
GBP/NZD💰Symbol: { GBP/NZD }
🟩Price: { 2.25722 & 2.24957 }
🟥Stop: { 2.26439 }
1️⃣profit: { 2.25014 }
2️⃣profit: { 2.24173 }
3️⃣profit: { 2.23417 }
4️⃣profit: { 2.22462 }
📊Check your chart before entering.
🚨Check before use to make sure there is no important news

GBP/NZD Vault Breach?! Ready for a Clean Bullish Heist?🔓💷 GBP/NZD — The Sterling Vault Heist Plan 🐱💻💰💹
🌟Hi! Hola! Ola! Bonjour! Hallo! Marhaba!🌟
To all the Money Makers, Market Magicians, and Chart Whisperers — it's time for another precision strike in the forex jungle! 🤑📊⚔️
🚨 Operation: GBP/NZD – Sterling vs Kiwi Bank Play 🚨
We're eyeing a bullish b

See all ideas
Summarizing what the indicators are suggesting.
Oscillators
Neutral
SellBuy
Strong sellStrong buy
Strong sellSellNeutralBuyStrong buy
Oscillators
Neutral
SellBuy
Strong sellStrong buy
Strong sellSellNeutralBuyStrong buy
Summary
Neutral
SellBuy
Strong sellStrong buy
Strong sellSellNeutralBuyStrong buy
Summary
Neutral
SellBuy
Strong sellStrong buy
Strong sellSellNeutralBuyStrong buy
Summary
Neutral
SellBuy
Strong sellStrong buy
Strong sellSellNeutralBuyStrong buy
Moving Averages
Neutral
SellBuy
Strong sellStrong buy
Strong sellSellNeutralBuyStrong buy
Moving Averages
Neutral
SellBuy
Strong sellStrong buy
Strong sellSellNeutralBuyStrong buy
Displays a symbol's price movements over previous years to identify recurring trends.
Frequently Asked Questions
The current rate of NZDGBP is 0.44525 GBP — it has increased by 0.19% in the past 24 hours. See more of NZDGBP rate dynamics on the detailed chart.
The value of the NZDGBP pair is quoted as 1 NZD per x GBP. For example, if the pair is trading at 1.50, it means it takes 1.5 GBP to buy 1 NZD.
The term volatility describes the risk related to the changes in an asset's value. NZDGBP has the volatility rating of 0.51%. Track all currencies' changes with our live Forex Heatmap and prepare for markets volatility.
The NZDGBP showed a 0.15% rise over the past week, the month change is a 0.05% rise, and over the last year it has decreased by −5.67%. Track live rate changes on the NZDGBP chart.
Learn how you can make money on rate changes in numerous trading ideas created by our community.
Learn how you can make money on rate changes in numerous trading ideas created by our community.
NZDGBP is a minor currency pair, i.e. a popular pair that is not associated with USD. Such pairs are also called cross currency pairs.
Currencies are usually traded through forex brokers — choose the one that suits your needs and go ahead. You can trade NZDGBP right from TradingView charts — just log in to you broker account. Check out the list of our integrated brokers and find the best one for your needs and strategy.
When deciding to buy or sell currency one should keep in mind many factors including current geopolitical situation, interest rates, and other. But before plunging into a deep research, you can start with NZDGBP technical analysis. The technical rating for the pair is buy today, but don't forget that markets can be very unstable, so don't stop here. According to our 1 week rating the NZDGBP shows the neutral signal, and 1 month rating is sell. See more of NZDGBP technicals for a more comprehensive analysis.