NZDGBP trade ideas

GBP-NZD Potential Short! Sell!
Hello,Traders!
GBP-NZD is making a local
Bullish move upwards and the
Pair will soon hit a horizontal
Resistance of 2.2620 and after
The retest a local bearish
Correction is to be expected
Sell!
Comment and subscribe to help us grow!
Check out other forecasts below too!
Disclosure: I am part of Trade Nation's Influencer program and receive a monthly fee for using their TradingView charts in my analysis.

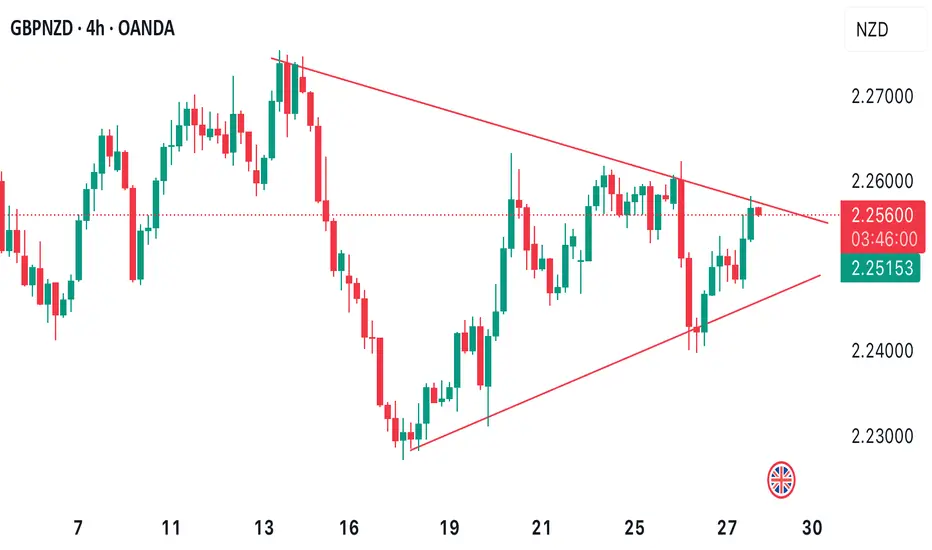
GBPNZD SOON TO EXPLODE!Price is currently forming a symmetrical triangle as we’ve seen both the presence of buyers & sellers for the last 3 weeks now. We’re looking forward to seeing price either breaking to the upside for further bullish price action or breaking to the downside for a potential correction of price.
Keep a close watch!
GBPNZD Sell Limit: Shorting from Key Resistance at 2.2590📉 GBPNZD: Sell Limit Trade Idea (Intraday)
Published: 27/03/2025 16:06 | Expires: 28/03/2025 15:00
Overview
Trading Bias: Mixed and volatile, with a preference to sell into rallies.
Market Context: GBPNZD has been showing short-term volatility, with the RSI trending higher, indicating potential for a temporary move upward before resuming the downtrend.
Trade Details
Entry (Sell Limit): 2.2590
Stop Loss: 2.2650 (-60 pips)
Take Profit: 2.2350 (+240 pips)
Risk/Reward Ratio: 4:1
Key Levels
Resistance Levels:
R1: 2.2590 (Bespoke resistance, preferred entry point)
R2: 2.2620
R3: 2.2680
Support Levels:
S1: 2.2450
S2: 2.2400
S3: 2.2330
Rationale
Preferred Setup: We expect a temporary rally into resistance at 2.2590, providing a favorable entry point to initiate short positions.
Momentum: While RSI indicates higher momentum in the short term, this aligns with a corrective rally rather than a sustained bullish move.
Volatility Risks: Key UK economic events (retail sales figures and national accounts) on 28/03/2025 at 07:00 GMT could trigger significant price swings. Traders should closely monitor these data points.
Disclosure: I am part of Trade Nation's Influencer program and receive a monthly fee for using their TradingView charts in my analysis.

GBPNZD Sell GBPNZD is showing a Change of Character (ChoCh) on the Daily, signaling a potential shift in market structure. This is further reinforced by a double top confirmation on the 4-hour timeframe, indicating strong resistance and potential exhaustion of buyers. With price rejecting key levels and bearish momentum building, this setup presents a high-probability sell opportunity, especially if we see a strong bearish break and retest.

GBPNZD is in Selling DirectionHello Traders
In This Chart GBPNZD 4 HOURLY Forex Forecast By FOREX PLANET
today GBPNZD analysis 👆
🟢This Chart includes GBPNZD market update)
🟢What is The Next Opportunity on GBPNZD Market
🟢how to Enter to the Valid Entry With Assurance Profit
This CHART is For Trader's that Want to Improve Their Technical Analysis Skills and Their Trading By Understanding How To Analyze The Market Using Multiple Timeframes and Understanding The Bigger Picture on the Charts

Reverse or keeping on? GBPNZDin Daily Time frame GBPNZD is on a potential reverse zone. if you see reverse sign you can have a short position to lower order block or lower blue zone

gbpnzd buy signal. Don't forget about stop-loss.
Write in the comments all your questions and instruments analysis of which you want to see.
Friends, push the like button, write a comment, and share with your mates - that would be the best THANK YOU.
P.S. I personally will open entry if the price will show it according to my strategy.
Always make your analysis before a trade

GBPNZDPrice reached a strong resistance zone and seemed to have failed to go above it. Now we've got a geeky head and shoulder on the daily and h4 with neckline being broken. we wait and see a retest with bearish confirmations before shorting.

GBPNZD: Fractured Ascent Signals Potential ReversalGBPNZD 4-hour chart reveals a compelling narrative of a weakening bullish trend potentially poised for a significant reversal. The pair's recent price action exhibits characteristics of a rising wedge pattern, a formation often indicative of an impending downside breakout.
Key Technical Observations:
Rising Wedge Formation: The converging trendlines point to a potential exhaustion of the upward momentum. The upper trendline has seen repeated rejections, suggesting a lack of sustained buying pressure.
Critical Support Level: The 2.25359 level is acting as a crucial support zone. A decisive break below this level would confirm the wedge breakdown and likely trigger a sharp bearish move.
Resistance Zone: The area around 2.27505 represents a significant resistance zone. Failure to break above this level reinforces the bearish outlook.
Potential Downside Targets: The chart indicates potential targets at 2.22934 and the low of 2.16774. These levels could act as significant support zones during a potential downtrend.
Trading Implications:
Short Entry Consideration: Traders should closely monitor the price action for a decisive break below the 2.25359 support. A confirmed breakdown could signal a strong short entry opportunity.
Stop-Loss Placement: A prudent stop-loss should be positioned above the recent swing high or the upper trendline of the wedge to mitigate risk.
Risk Management: Given the potential for increased volatility during a breakout, sound risk management is paramount.
Considerations:
Confirmation of Breakdown: A break below the 2.25359 support should be accompanied by strong bearish momentum and ideally, an increase in trading volume to validate the signal.
Fundamental Factors: Upcoming economic data releases from both the UK and New Zealand should be closely monitored, as they could significantly impact the pair's price action.
Conclusion:
The GBPNZD chart presents a compelling case for a potential bearish reversal. The rising wedge pattern, coupled with the critical support at 2.25359, suggests a high probability of a downside breakout. Traders should exercise caution and await confirmation of the breakdown before initiating short positions. Effective risk management is crucial to navigate the potential volatility associated with this trade setup.

ShortOn the 1D GBPNZD hit the resistance, which in previous cases afterwards it hit the support trendline and then bounced.
And then on the 4H it made a double top afterwards from which it made a bull trap and price went down by making a lower low and now it bounced right off the FVG and broke the 4H trendline, so for me GBPNZD should be going even lower, maybe to support.
www.tradingview.com

GBPNZD SELLA quick wave 2 correction for GBPNZD.
Will also be looking for a buy entry after the correction

GBPNZD long Biasprice is on an uptrend, after testing last resistance zone with 50% Fibonacci level price has confirmed my scenario to go long after break and retest a minor structure, entry would've been more precise on the 200 moving average touch, but that was missed and price give me another good sniper entry after retest, and I expect bullish run

GU UpdateThe latest COT data reveals a net long position among speculative traders for the British Pound, indicating bullish sentiment. Concurrently, technical analyses from multiple reputable sources suggest a buying opportunity for GBP/NZD. Therefore, based on the current data, the direction for GBP/NZD in the days ahead appears to be upward to the resistance TL

Weekly overview Overview of the week and position taken on USDJPY and trade I decided not to take on AUDCHF.

GBP/NZD BEARS ARE STRONG HERE|SHORT
Hello, Friends!
GBP/NZD pair is trading in a local uptrend which we know by looking at the previous 1W candle which is green. On the 5H timeframe the pair is going up too. The pair is overbought because the price is close to the upper band of the BB indicator. So we are looking to sell the pair with the upper BB line acting as resistance. The next target is 2.240 area.
Disclosure: I am part of Trade Nation's Influencer program and receive a monthly fee for using their TradingView charts in my analysis.
✅LIKE AND COMMENT MY IDEAS✅

GBP/NZD (15M) Analysis – 24-03-2025📊 GBP/NZD (15M) Analysis – 24-03-2025
📈 Current Price: 2.25787
🔴 Supply Zone (Resistance): 2.26715 – Potential area for reversal.
🟢 Demand Zones (Support):
2.2502 – Key level for possible bullish reaction.
2.24710 – Strong support zone.
📌 Market Outlook:
Price is in an uptrend but may retrace to the 2.2502 - 2.24710 demand zone before continuing upward.
Scenario 1: If price bounces from 2.2502 - 2.24710, expect a move towards 2.26112 (TP1) and potentially 2.26715 (TP2).
Scenario 2: If price breaks below 2.24710, bearish momentum may increase.
⚡ Trade Setup:
🔻 Buy Setup: If rejection at 2.2502 - 2.24710
🎯 TP1: 2.26112
🎯 TP2: 2.26715
🛑 SL: Below 2.24600
#GBPNZD #ForexAnalysis #SmartMoney #Trading #PriceAction 🚀📊

longgbpnzd breaks support ,market have the good digestion higher the chances for the market to touch above resistance levels

GN update correctionRecent data from Forex Factory indicates that the British Pound (GBP) is under pressure due to weak domestic economic figures and prevailing uncertainty. In contrast, the New Zealand Dollar (NZD) is benefiting from robust commodity-related fundamentals.
The latest Commitment of Traders (COT) report reveals that large speculators have been reducing their net-long positions in GBP futures, signaling a bearish sentiment toward the pound.
Combining these factors, the near-term outlook for GBP/NZD appears bearish. Traders should monitor key support levels, as a breach could lead to further declines. However, any unexpected positive developments in UK economic data or shifts in global risk sentiment could provide temporary support for the pair.
Expecting Long first then short

GBPNZD REBOUNDS AT SUPPORT LEVEL OF 2.23243Price recently rebounds at the support level of 2.23243 we may likely continue to see bullish price action developments in coming days. Ahead of GBP inflation rate report and good trade balance report set to be released in coming days of the week, we anticipate bullish price action to continue surging higher.

GN updateRecent posts on Forex Factory indicate that the fundamentals for both the British Pound and the New Zealand Dollar are showing mixed signals—with the Pound gaining some support from improved UK economic data, while concerns persist over New Zealand’s outlook amid global risk–off sentiments. Meanwhile, the latest COT report shows that large institutional traders are leaning toward a stronger GBP positioning relative to the Kiwi.
Taken together, these factors suggest that GBPNZD is likely to edge higher over the coming days, as the Pound outperforms New Zealand’s Dollar in the near term.
Awaiting bullish move to convergence point on technicals

GBP/NZD Short Setup AnalysisGBP/NZD 4H Trading Analysis – Bearish Setup
📉 Potential Short Opportunity
🔹 Structure Breakdown:
The market broke a rising wedge pattern, signaling a potential downtrend. Price has retraced to key Fibonacci levels, providing a possible entry for short positions.
🔹 Fibonacci Levels:
61.8% (2.2565)
71% (2.2609)
78.6% (2.2648)
These levels act as resistance zones where sellers may step in. A rejection from this area could confirm further downside movement.
🔹 Entry & Confirmation:
Ideal short entry: 2.2565 - 2.2609 zone (Fibonacci resistance)
Stop Loss: Above 2.2750 (100% Fib level & structure high)
Target 1: 2.2200 (-27% Fib extension)
Target 2: 2.1963 (-61.8% Fib extension)
🔹 Confluence Factors:
✅ Retest of previous support-turned-resistance
✅ Bearish momentum following the wedge breakdown
✅ Fibonacci retracement aligning with resistance

GBPNZD (2H Chart) – Precision BreakdownElliott Wave Analysis of GBPNZD
1. Market Structure & Current Position
Current Trend: The price is moving within a well-defined ascending channel** with higher highs and higher lows.
Recent Movement :A sharp rally to the upper trendline (~2.2750), followed by a correction.
Critical Level: The price is testing mid-channel support (~2.2450), a potential decision zone.
---
2. Elliott Wave Count (Detailed Breakdown)
Based on the structure, the chart exhibits a **5-wave impulse move, possibly followed by an ABC correction
Impulse Wave Structure (Main Trend)
1️⃣ **Wave 1:Strong push from 2.1850 → 2.2350 (Initiation)
2️⃣ **Wave 2: Pullback to 2.1950(Shallow retracement)
3️⃣ **Wave 3:Strong breakout, extending past 2.2750(Largest move, extended wave)
4️⃣ **Wave 4:Current correction to **2.2450 - 2.2350
5️⃣ **Wave 5 (Projected):If wave count is correct, **final push towards 2.2800 - 2.2900
🔹 Wave 3 Validation: The strongest and longest wave, confirming an Elliott impulse pattern.
🔹 Wave 4 Confirmation: Corrections usually respect the previous **Wave 1 territory, which aligns with the channel bottom (~2.2350).
Corrective Structure (If Wave 5 Fails)
Scenario A: Classic Zig-Zag Correction (ABC)
- A: Drop from 2.2750 to 2.2450
- B: Short retracement (possibly back to 2.2600)
- C: Further decline to **2.2200 - 2.1850**
Scenario B: Running Flat Correction
- Price hovers in **2.2350 - 2.2600** range before deciding direction.
3. Key Technical Levels
Bullish Case (Wave 5 Continues)
✅ Support:
2.2350 - 2.2450** (Wave 4 support, channel midline)
2.2200** (Breakdown level)
✅ Resistance Targets:
2.2750** (Previous high, key breakout level)
2.2850 - 2.2900** (Final Wave 5 extension zone)
---
4. Probable Scenarios & Probability %
✅ Scenario 1: Wave 5 Continuation (60%)
- If price holds 2.2350, expect a final bullish wave toward 2.2850 - 2.2900.
- Confirmation: Strong bullish rejection at support.
⚠️ Scenario 2: ABC Correction (Bearish Pullback) (40%)
- If price **breaks 2.2350**, we could see a larger retracement to **2.2200 - 2.1850**.
- Confirmation: A **break and close below 2.2350** with bearish momentum.
5. Conclusion & Trading Strategy
📌 Bias: Bullish continuation (Wave 5) unless 2.2350 breaks.
📌 Trade Setup:
- Long entry: Buy between 2.2400 - 2.2450 with a tight stop below 2.2300.
- Short entry: If price **breaks below 2.2350, sell targeting 2.2200 - 2.1850.
📌 Final Thoughts: The next few hours** will confirm whether Wave 5 is valid or we enter a corrective phase. Monitor price action closely.
