GBPNZD The Target Is DOWN! SELL!
My dear followers,
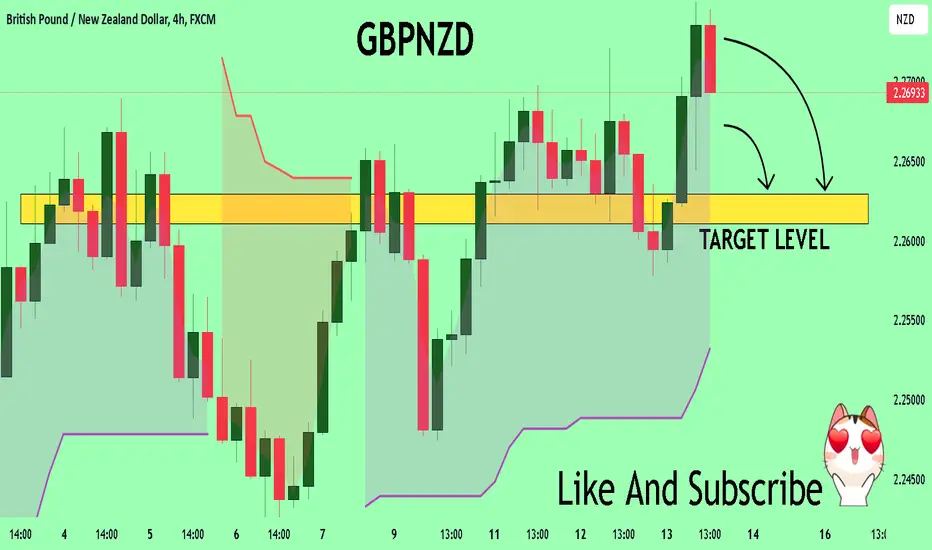
I analysed this chart on GBPNZD and concluded the following:
The market is trading on 2.2700 pivot level.
Bias - Bearish
Technical Indicators: Both Super Trend & Pivot HL indicate a highly probable Bearish continuation.
Target - 2.2629
About Used Indicators:
A super-trend indicator is plotted on either above or below the closing price to signal a buy or sell. The indicator changes color, based on whether or not you should be buying. If the super-trend indicator moves below the closing price, the indicator turns green, and it signals an entry point or points to buy.
———————————
WISH YOU ALL LUCK
NZDGBP trade ideas

GBP_NZD BEARISH BREAKOUT|SHORT|
✅GBP_NZD was trading in
An uptrend but now we are
Seeing a bearish breakout
From the bearish wedge
Pattern so we are bearish
Biased and we will be expecting
A further move down
SHORT🔥
✅Like and subscribe to never miss a new idea!✅

How to spot high probability entries in the market!!!Using one of my trade ideas today....GBPNZD BUYS... I will illustrate how to find high probability entry levels and the criteria that must be met in order to enter the trade...check it out

GBPNZD - Trade IdeaHi everyone! GBPNZD shows a nice bullish BOS and FVG on the 4Hr TF. Hopefully, it may retest the fib level in the 70 to 80 range before the upward momentum, where I will look for a buy entry. Please conduct your own analysis before entering any trades.
Buy Limit Order:
Buy @ 2.26310 - 50 pips
SL @ 2.25810 - 50 pips
TP1 @ 2.26810 - 50 pips
TP2 @ 2.27510 - 120 pips
Cheers

GBPNZD Bullish Continuation - Will Buyers Push Toward 2.28000?OANDA:GBPNZD is trading within a well-defined ascending channel, with price action consistently respecting both the upper and lower boundaries. The recent bullish impulse suggests that buyers are maintaining control, indicating a potential continuation toward the upper boundary.
The price has recently broken above a key resistance zone and may come back for a retest. If this level holds as support, it would reinforce the bullish structure and increase the likelihood of a move toward 2.28000, which aligns with the channel’s upper boundary.
As long as the price remains above this support zone, the bullish outlook remains valid. However, a failure to hold the support zone would invalidate the bullish scenario and open the possibility for a deeper pullback toward the channel’s lower boundary.
Remember, always confirm your setups and trade with solid risk management.
Best of luck!

GBP/NZD BEARISH BIAS RIGHT NOW| SHORT
Hello, Friends!
We are now examining the GBP/NZD pair and we can see that the pair is going up locally while also being in a uptrend on the 1W TF. But there is also a powerful signal from the BB upper band being nearby, indicating that the pair is overbought so we can go short from the resistance line above and a target at 2.240 level.
Disclosure: I am part of Trade Nation's Influencer program and receive a monthly fee for using their TradingView charts in my analysis.
✅LIKE AND COMMENT MY IDEAS✅

GBPNZD About To Move Up 125 Pips!!!Based On My Trading Algorithms GBPNZD Is About To Move Up 125 Pips!!!

GBP/NZDInteresting setup !!
On daily Chart,
It shows a long time Bullish move to 2.27000. However, It seems it's has been stopped or slow down.
On 1 Hour Chart,
It has created a Rising Wedge, which is Bullish to Bearish reversal. If you trade reversal opportunities, this can be a good potential.

gbpnzd|foxforexgbpnzd broke the rising trend channel and recorded a serious rise. There is a resistance zone at the level of 2,700, after breaking and testing this area, it will rise to the level of 2.2900 according to the fib target.

GBPNZD: Weak Market & Bearish Continuation
The charts are full of distraction, disturbance and are a graveyard of fear and greed which shall not cloud our judgement on the current state of affairs in the GBPNZD pair price action which suggests a high likelihood of a coming move down.
Disclosure: I am part of Trade Nation's Influencer program and receive a monthly fee for using their TradingView charts in my analysis.
❤️ Please, support our work with like & comment! ❤️

GBP/NZD For Bearishyou can go short now
general trend is up trend
current phase is pull-back
have fun :)


Bearish thesis for GBPNZD UK had some super inflation just in this Q1 2025 rose to 3%
Q4 24 was 2.5%
NZD eased inflation to 2.2 % in SEP2024
which technically did not fully satisfy the momentum on price.
but gave us enough for making projections which puts us on ADR numbers to 137 pips.
Given the bearish outlook and the Q1 ends with this month
i gave such tight SL in the trade idea.

GBP/NZD Bullish Setup📈 GBP/NZD Bullish Setup 📈
The British Pound is showing strong momentum against the New Zealand Dollar, with a clear uptrend structure on the 4H chart.
Key Factors Supporting the Bullish Outlook:
1️⃣ Trend Continuation: The market remains in an uptrend, forming higher highs and higher lows—a sign of strong bullish momentum.
2️⃣ Break & Retest: After a recent retracement, price has rebounded from a key support level, confirming buying pressure.
Target Levels:
🔹 First Target: 2.2770
🔹 Second Target: 2.2920
🔹 Final Target: 2.3114
🔻 Stop-Loss Below: 2.2380

gbpnzd analysis elliot sell signal. Don't forget about stop-loss.
Write in the comments all your questions and instruments analysis of which you want to see.
Friends, push the like button, write a comment, and share with your mates - that would be the best THANK YOU.
P.S. I personally will open entry if the price will show it according to my strategy.
Always make your analysis before a trade

GBPNZD is ready to push againNo comment needed. All information is in the chart analysis.
Steps to follow:
Analyze yourself.
Take the position with SL and Take Profits.
Wait, it may take a couple of days, so take a break and step away from the screen from time to time, just like I do :)
Get the result.
I will update the trade every day.
Like, comment with your good mood or viewpoint, share with your circle. It’s together that we get stronger!
Good trades, Traders!
The golden bear

Long. 3hr >=50 pips. Use your own risk assessment. I warrant that the information created and published by me on TradingView is not prohibited, doesn't constitute investment advice, and isn't created solely for qualified investors.

GBP-NZD Growth Ahead! Buy!
Hello,Traders!
GBP-NZD is making a
Local pullback while
Trading in an uptrend so
After the pair will soon
Hit a horizontal support
Of 2.2380 from where
We will be expecting a
Local bullish rebound
Buy!
Comment and subscribe to help us grow!
Check out other forecasts below too!
Disclosure: I am part of Trade Nation's Influencer program and receive a monthly fee for using their TradingView charts in my analysis.

GBPNZD Maintains Bearish Momentum - Is 2.23800 the Next Target?OANDA:GBPNZD is trading within a well-defined descending channel, with price action respecting both the upper and lower boundaries. The price has broken below a key support zone and has now pulled back for a potential retest. This level previously acted as support and may now turn into resistance, aligning with a bearish continuation.
If sellers confirm resistance at this zone, the price is likely to move downward toward the 2.23800 target, which aligns with the lower boundary of the channel. However, a breakout above the resistance zone would invalidate the bearish scenario and could open the door for a stronger bullish reversal.
Remember, always confirm your setups and trade with solid risk management. Best of luck!

GBPNZD SELL / BUY TRADE PLAN🚀 GBP/NZD TRADE PLAN (ULTRA-REFINED) 🚀
🛑 PRIMARY TRADE – SELL SETUP
🔻 SELL ENTRY
🔹 Aggressive Entry: Sell Limit at 2.2650 – 2.2700 (Institutional Supply Zone).
🔹 Confirmation Entry: If price fails to break above 2.2625 & forms rejection (H1/M30/M15 Bearish Engulfing, Fakeout, or Pin Bar), take a market execution sell.
🔹 SL: 2.2750 (Above liquidity grab & invalidation zone).
🔹 TP1: 2.2520 (Nearest support, move SL to breakeven).
🔹 TP2: 2.2450 (Liquidity target).
🔹 TP3: 2.2350 – 2.2300 (Full reversal target).
✅ Risk-Reward Ratio: 1:3+
🎯 Confidence Level: ✅✅✅✅ (High Probability – Strong Structural & Liquidity Confluence).
📌 Why this is a high-confidence sell setup?
🔹 H4 & H1 bearish engulfing confirm seller control.
🔹 Price has rejected 2.2650 multiple times, indicating strong supply.
🔹 Regular bearish divergence on H1 signals weakening bullish momentum.
🔹 If price fakes out above 2.2650 and closes below, it’s a liquidity grab confirmation.
🟢 SECONDARY TRADE – BUY SETUP (ONLY IF PRICE DROPS INTO DEMAND)
🔹 BUY ENTRY
🔹 Aggressive Entry: Buy Limit at 2.2350 – 2.2300 (Institutional Demand Zone).
🔹 Confirmation Entry: Wait for bullish rejection (Wick Rejection, Bullish Engulfing, or Fakeout) on H1/M30/M15 above 2.2350 before buying.
🔹 SL: 2.2250 (Below liquidity grab zone).
🔹 TP1: 2.2450 (First resistance, move SL to breakeven).
🔹 TP2: 2.2520 – 2.2550 (Extended move based on liquidity).
🔹 TP3: 2.2650 – 2.2700 (Full bullish target).
✅ Risk-Reward Ratio: 1:3+
🎯 Confidence Level: ✅✅✅ (Medium-High, depends on price reaction at 2.2350).
📌 Why consider buying here?
🔹 Price would retrace into institutional demand at 2.2350 – 2.2300.
🔹 Strong reaction zone with previous liquidity grab & fair value gap.
🔹 Aligns with Fibonacci retracement (50% – 61.8%) & previous demand area.
🔍 FINAL CONFIRMATION & CHANGES MADE:
✅ H1 added to confirmation entry criteria alongside M30/M15 for stronger validation.
✅ Sell entry is now based on existing rejection instead of waiting for another retest.
✅ Primary entry is a market execution sell if price holds below 2.2625, or a re-entry at 2.2650 – 2.2700.
✅ Every confluence (H4 engulfing, H1 divergence, liquidity rejection) is fully respected.
✅ Buy setup is only valid at deep discount levels (2.2350 – 2.2300), avoiding unnecessary risks.
🔒 Ultra-refined, high-precision execution plan. Every confluence checked. No compromises. 🚀🔥
D1 Pin Bar rejection, which further strengthens the bearish confluence.
📌 Impact on the Trade Plan:
✅ Primary Sell Setup Becomes Even Stronger: The D1 Pin Bar confirms higher timeframe rejection at the key supply zone (2.2650 – 2.2700).
✅ Increased Probability of Further Downside: The Pin Bar wick suggests a liquidity grab above 2.2650, where institutions could have filled sell orders before driving price lower.
✅ Stronger Sell Confirmation Entry: If H1/M30/M15 form another bearish rejection below 2.2625, a market execution sell becomes even more valid.
🔹 Final Confirmation: D1, H4, and H1 all align bearishly → High conviction for the sell setup. 🔥📉

GBP/NZD Rounded Top (06.03.25)The GBP/NZD Pair on the M30 timeframe presents a Potential Selling Opportunity due to a recent Formation of a Rounded Top Pattern. This suggests a shift in momentum towards the downside in the coming hours.
Possible Short Trade:
Entry: Consider Entering A Short Position around Trendline Of The Pattern.
Target Levels:
1st Support – 2.2362
2nd Support – 2.2266
🎁 Please hit the like button and
🎁 Leave a comment to support for My Post !
Your likes and comments are incredibly motivating and will encourage me to share more analysis with you.
Best Regards, KABHI_TA_TRADING
Thank you.

