Weekly CLS, Key level - Daily FVG +Ob, Model 1, Bullish OFWeekly CLS, Key level - Daily FVG +Ob, Model 1, Bullish OF
you are welcome to comment with your thoughts and share your charts or questions below, I like any constructive discussion.
What is CLS?
This company is trading for the biggest investment banks and central banks. They trade over 6.5 trillion daily volume. They are smart money of the all markets.
CLS operates in the specific times which will give you huge advantage and precisions to you entries. Focus on that. Its accuracy is amazing.
Good luck and I hope this educational post helps to become better trader
“Adapt what is useful, reject what is useless, and add what is specifically your own.”
Dave FX Hunter ⚔
NZDGBP trade ideas

GBP/NZD Analysis:
AB = 78.6% Retracement:
This indicates that the AB leg was a deep retracement, forming the basis for the harmonic pattern. A deep retracement like 78.6% usually means the likelihood of a significant reversal increases when the D point is reached.
BC = 123.6% Extension:
The BC leg is extended, meaning the BC movement is wide. This could indicate that GBP/NZD is experiencing strong momentum, but it could also be a sign of "overextension."
CD = 141.4% Extension:
The CD leg is nearing the end of the harmonic pattern. The D point, which is where a reversal is expected, will be around the 141.4% of XA. This is the critical point where a decision can be made (buy or exit).
Risk and Reward:
Reward: If the D point holds (a reversal occurs), you can gain significant returns from the reversal. For instance, you could benefit from a strong upward (buy) or downward (sell) move when the price leaves the Potential Reversal Zone (PRZ).
Risk: If the D point is breached, GBP/NZD may continue its movement and break the harmonic pattern. This could lead to losses if you hold onto the wrong position.
Recommendations:
Wait for GBP/NZD to reach the D point (141.4% Fibonacci Extension).
Look for confirmation signals such as:
Divergence (MACD or RSI).
Candlestick patterns (e.g., engulfing candles or pin bars).
Make sure to use a stop-loss to protect in case the D point is breached:
Set your stop-loss outside the PRZ.
Reward-to-Risk Ratio: Aim for a reward at least 2:1 in relation to the risk you're taking

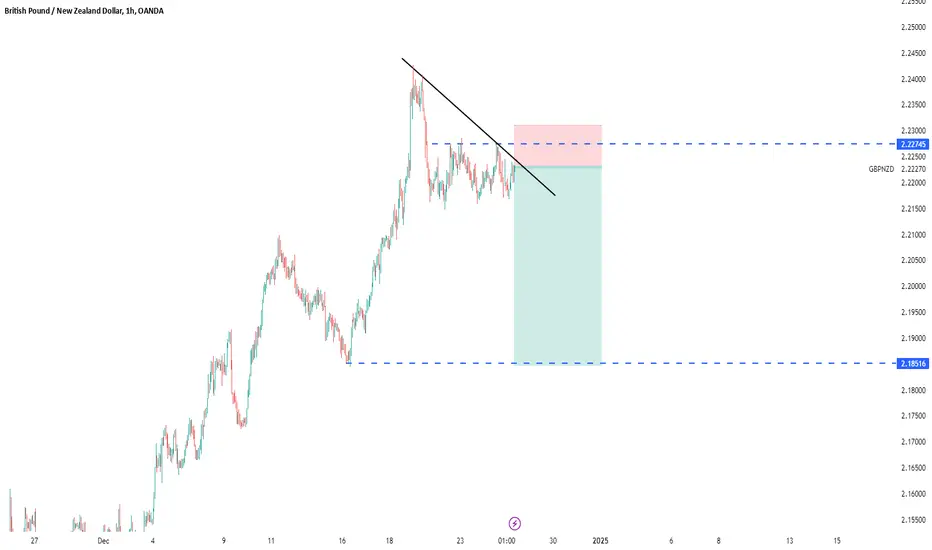
Daily Strong BUY Level GBPNZD - 2.18565 A straightforward yet effective strategy: a strong daily level for profit-taking following a significant downward move. The first target is 2.18998, with a small runner left in place in case of a rebound to higher levels. Please let me know if you have any questions.

Gbpnzd for buyPrice is bullish, price came to retest a major support zone and gave a bullish momentum candle.

Gbpnzd for buyPrice is bullish, price came to retest a major support zone and gave a bullish momentum candle.

POSSIBLE SELL OPPORTUNITY ON GBPNZDPrice showing signs of strong momentum. We look for the pullback to take the trade.

Short GBPNZDdo to the industries (pairs) in the GBP sectors, which as a weak beta less then 1 .. as not increased in value for week the recent few weeks of upward move was cause by AUD & NZD .. which it isn't the real value
Of the pair , so it's moving down aggressively

update. caught the recovery. played outThis Analysis Can Change At Anytime Without Notice And It Is Only For educational Purpose to Traders To Make Independent Investments Decisions.
Disclaimer
The information and publications are not meant to be, and do not constitute, financial, investment, trading, or other types of advice or recommendations supplied or endorsed by TradingView

Long entry ideaPrice is currently bullish making HH and HL. On the 4H TF price has tapped OTE and showed rejection. Waiting for a 4H bullish engulfing candle/iFVG to target -0.5 fib level.

GBP_NZD RISKY LONG|
✅GBP_NZD went down to retest a horizontal support of 2.2068
Which makes me locally bullish biased
And I think that a move up
From the level is to be expected
Towards the target above at 2.2160
LONG🚀
✅Like and subscribe to never miss a new idea!✅

GBPNZD-SELL strategy 2-Daily chart The pair has seen again lofty heights, but usually, when we spike above the regression channel, the pair must return over time to the mid-range at least. In combo with an overbought state, I feel we may see 2.1850 area in some weeks to come.
Strategy SELL @ 2.2300-2.2375 range and take profit at 2.1875 for now.

POSSIBLE BUY OPPORTUNITY ON GBPNZDPrice showing signs of strong momentum. We look for the pullback to take the trade.

GBPNZD-SELL strategy Daily chart (as well as 3D) chartThe pair is very overextended, in terms of RSI reading, even though we are in still a slightly upwards short-term move, and soon exhaustion is my viewpoint. The regression channel is useful as it intends to show severe outbreaks, and we have broken out and it requires a solid correction back to 2.1900 near-term.
Strategy SELL 2.2325 - 2.2425 range and take profit near 2.1875 for now.

GBPNZD: Correction Before the Next Leg Down?In GBPNZD, it appears we have completed a five-wave structure to the downside. Following the current correction, likely taking the form of a three-wave structure, I anticipate the market will resume its decline, continuing the broader bearish trend. Traders should watch for the correction to complete before considering short positions.

updateThis Analysis Can Change At Anytime Without Notice And It Is Only For educational Purpose to Traders To Make Independent Investments Decisions.
Disclaimer
The information and publications are not meant to be, and do not constitute, financial, investment, trading, or other types of advice or recommendations supplied or endorsed by TradingView

GBPNZD-SELL strategy 3D chartThe pair is overbought still and moving between the wide range of 2.2400 and 2.2100. Over all, it is top building, and the channel shows clearly we have a chance to see 2.1750 again
Strategy SELL @ 2.2280 - 2.2350 and take profit near 2.1875 for now.

New Week - GBPNZD : Bullish Trend - Dec 29th 2024 New Week - GBPNZD : Bullish Trend - Dec 29th 2024
.
By: Atlas aka Noble.Mike.Jamison

GBPNZD1. Current Market Situation (Wave 3):
The market is currently in Wave 3, which is usually the strongest and longest wave in Elliott Wave Theory.
Wave 3 is known for its powerful upward movement.
This is typically the wave where most traders and investors jump in, creating significant momentum.
2. Approaching the End of Wave 3:
Right now, Wave 3 doesn’t seem fully complete, but it’s close to its end. You can identify this because:
Momentum starts to slow down as the price nears resistance levels.
Wave 3 often reaches Fibonacci extensions like 1.618 or 2.618, which are key indicators for its completion.
3. Retracement in Wave 4:
After Wave 3 finishes, the price will likely pull back into Wave 4. This is a normal retracement where the market consolidates some of Wave 3’s gains.
The retracement typically hits Fibonacci retracement levels of 0.382 or 0.5.
Wave 4 is usually a smoother and less volatile wave compared to Wave 2.
4. Completion in Wave 5:
Finally, Wave 5 is the last wave in the trend. This wave completes the overall upward movement.
Wave 5 generally creates a new high, but it’s often less strong compared to Wave 3.
Key Takeaways:
Right now, the market is still in Wave 3 but close to finishing it. After that:
Expect the price to pull back into Wave 4 at around Fibonacci 0.382 or 0.5 retracement levels.
Wave 5 will follow, taking the price higher to finish the trend.
Pro Tip:
If you're trading, wait to confirm the end of Wave 3 and the start of Wave 4 before entering. Using tools like RSI or MACD can help you verify the momentum and trend shifts.

GBPNZD - Long from bullish order block !!Hello traders!
‼️ This is my perspective on GBPNZD.
Technical analysis: Here we are in a bullish market structure from daily timeframe perspective, so I look for a long. I wait price to continue the retracement to fill the imbalance lower and then to reject from bullish order block + institutional big figure 2.20000.
Like, comment and subscribe to be in touch with my content!

Atlas Mid-Week Update - Dec 26th 2024Atlas Mid-Week Update - Dec 26th 2024
.
By: Atlas aka Noble.Mike.Jamison

gbpaud sell signal. Don't forget about stop-loss.
Write in the comments all your questions and instruments analysis of which you want to see.
Friends, push the like button, write a comment, and share with your mates - that would be the best THANK YOU.
P.S. I personally will open entry if the price will show it according to my strategy.
Always make your analysis before a trade
#GBPNZD Daily Forecast: Targeting 2.23I am forecasting a bullish movement for the GBPNZD currency pair on the daily timeframe, with a Take Profit (TP) target of 2.23. This projection is based on both technical and fundamental factors that suggest a continuation of upward momentum.

GBP/NZD 4H Timeframe AnalysisGBP/NZD 4H Timeframe Analysis
Trend Analysis:
On the 4-hour timeframe, the GBP/NZD pair remains in an uptrend, forming a series of higher highs and higher lows. Price recently bounced from a major support level, allowing buyers to regain momentum and push the price higher.
The pair broke through a minor key resistance zone at 2.19900–2.21600, continuing its bullish move toward the next minor resistance at 2.24200. However, a doji candlestick formed below this level, signaling indecision, and was followed by a bearish candle, prompting a reversal back to the minor support zone.
Price is now consolidating and accumulating buyer orders above this minor key support. We anticipate a continuation of the bullish trend but remain cautious of a potential break below this level, which could trigger stop-loss liquidations before a renewed upward move.
Price Action Expectation:
Our objective is to wait for additional liquidity to build within the liquidity zone. Once confirmed, we will watch for a bullish breakout above the trendline.
Entry Plan:
Place a buy stop order at 2.22050 to confirm entry upon a bullish breakout.
Stop Loss: Set at 2.21170, below the liquidity grab area for effective risk management.
Take Profit: Target the recent resistance at 2.24200, providing a 1:2 risk-to-reward ratio.
Key Levels to Monitor:
Support Zone: 2.19900–2.21600
Resistance Zone: 2.24200
Additional Considerations:
Watch for price accumulation and liquidity grabs within the support zone.
Monitor candlestick patterns and price behavior near the trendline for breakout confirmation.
Conclusion:
GBP/NZD shows bullish potential as price consolidates above the minor support zone. A breakout above 2.22050 would confirm the continuation of the uptrend, targeting 2.24200 for a compelling 1:2 risk-to-reward ratio. However, stay vigilant for a potential break below the support zone to account for possible stop-loss liquidations before a renewed upward move.
