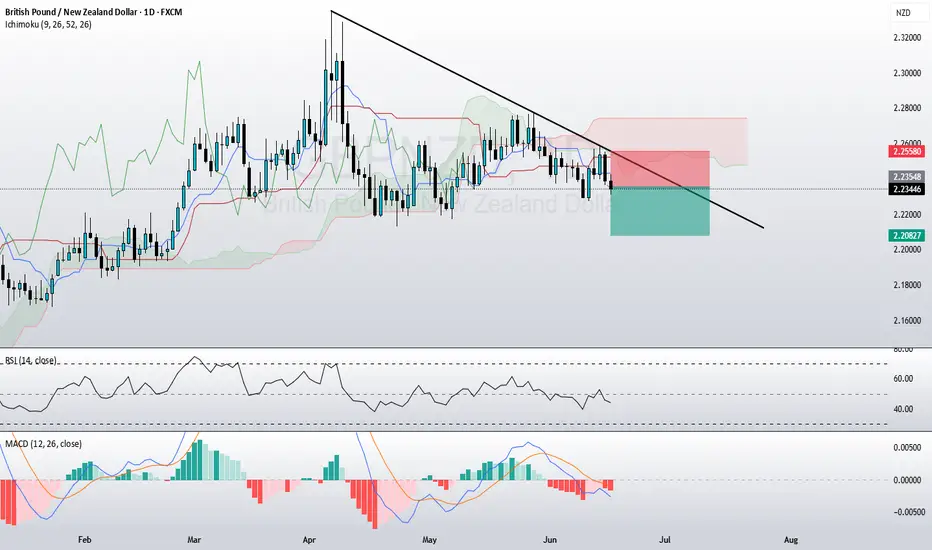
GBPNZD SHORT (swing idea)This is a very good short trade setup. The price is trading below the Ichimoku cloud, as well as the 50-day and 100-day moving averages. The bearish momentum is confirmed by the downward trendline, the MACD being below zero (indicating bearish sentiment), and the RSI, which is also below 50.
NZDGBP trade ideas
Long gbpnzdIn my previous analysis, we longed Gbpnzd but after 50pips in profits, it retraced and it hit sl. I belive daily candle will end as bullish today. We can buy with today's low as sl

GBP/NZD: The Great Liquidity Grab? (Long Trade Plan)"🏦💰 GBP/NZD BANK VAULT RAID: Bullish Heist in Progress! (Long Setup) 💰🏦
🚨 Overbought Trap? Or Trend Continuation? Here’s How to Loot Pips Safely! 🚨
🦸♂️ GREETINGS, MARKET MARAUDERS!
To all the Profit Pirates & Risk-Takers! 🌍💸
Using our 🔥Thief Trading Tactics🔥 (a ruthless combo of price action + liquidity grabs + macro triggers), we’re executing a bullish heist on GBP/NZD ("Sterling vs Kiwi")—this is not advice, just a strategic raid blueprint for those who trade like outlaws.
📈 THE HEIST PLAN (LONG ENTRY FOCUS)
🎯 Profit Zone: 2.28700 (or escape earlier if momentum stalls)
💥 High-Stakes Play: Overbought but squeezing higher—trap for bears.
🕵️♂️ Trap Spot: Where sellers get liquidated.
🔑 ENTRY RULES:
"The Vault’s Open!" – Swipe bullish loot on pullbacks (15-30min TF).
Buy Limit Orders near swing lows for better risk/reward.
Aggressive? Enter at market—but tighter stops.
📌 SET ALERTS! Don’t miss the breakout retest.
🛑 STOP LOSS (Escape Route):
Thief SL at recent swing low (2H timeframe).
⚠️ Warning: "Ignore this SL? Enjoy donating to the market."
🎯 TARGETS:
Main Take-Profit: 2.28700 (or trail partials).
Scalpers: Ride long waves only. Trailing SL = VIP exit pass.
📡 FUNDAMENTAL BACKUP (Why This Heist Works)
Before raiding, check:
✅ COT Data (Are funds long GBP/short NZD?)
✅ Rate Spreads (GBP vs NZD yield shifts)
✅ Commodity Correlations (Dairy prices? Risk mood?)
✅ Sentiment Extreme (Retail over-shorting?)
🚨 NEWS RISK ALERT
Avoid new trades during RBNZ/BOE speeches (unless you like volatility casinos).
Trailing stops = your bulletproof vest.
💣 BOOST THIS HEIST!
👍 Smash Like to fuel our next raid!
🔁 Share to recruit more trading bandits!
🤑 See you at the target, rebels!
⚖️ DISCLAIMER: Hypothetical scenario. Trade at your own risk.
#Forex #GBPNZD #TradingView #LiquidityGrab #TrendContinuation #ThiefTrading
💬 COMMENT: "Long already—or waiting for a deeper pullback?" 👇🔥

GBPNZD SELL IDEA- Weekly chart - Ranging market with price forming a double top before falling from the resistance.
- Daily chart - Ranging market with strong bearish fall. Price didn't respect the bullish trendline as well.
- H4 chart - Price is forming a series of LHs and LLs and currently testing a minor support level for further fall.
Entry would be close below the minor support level on H4 and retest on H1 and M30. This pair runs like thieves, so be observant, or you'd miss out on this clean trade

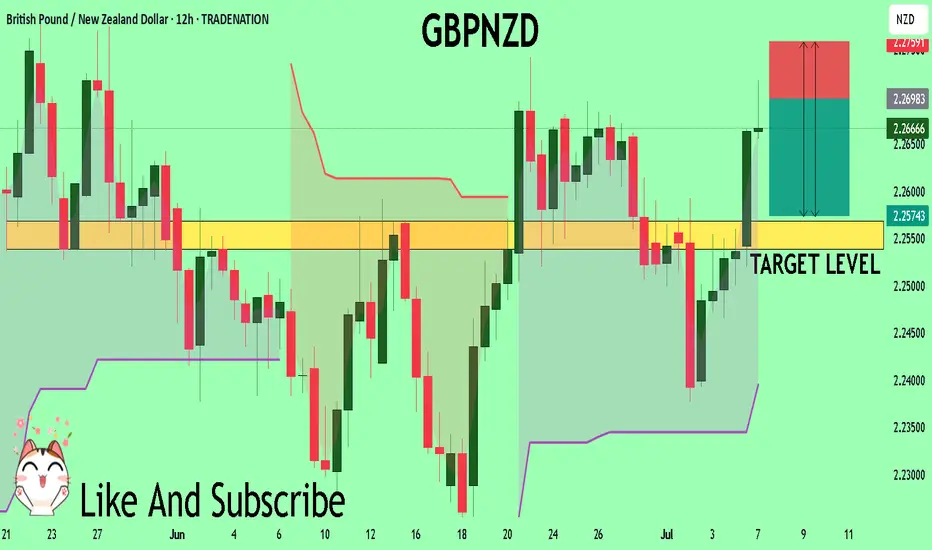
GN will go down to value area lowBeen missed out trade on this one. I can only sell whenever retraces, target at value area low

GBPNZD TRADE Based on trade management techniques/systems put in place, you still get to follow the move to the upside and then avoid any losses. Incase something like this occurs.
A similar thing also occurred on GBPAUD.

GBPNZD Is Bearish! Sell!
Please, check our technical outlook for GBPNZD.
Time Frame: 1h
Current Trend: Bearish
Sentiment: Overbought (based on 7-period RSI)
Forecast: Bearish
The market is approaching a key horizontal level 2.248.
Considering the today's price action, probabilities will be high to see a movement to 2.241.
P.S
Overbought describes a period of time where there has been a significant and consistent upward move in price over a period of time without much pullback.
Disclosure: I am part of Trade Nation's Influencer program and receive a monthly fee for using their TradingView charts in my analysis.
Like and subscribe and comment my ideas if you enjoy them!

GBP/NZD – Bearish Continuation Setup in Play
🔹 2H Chart Analysis by PULSETRADESFX
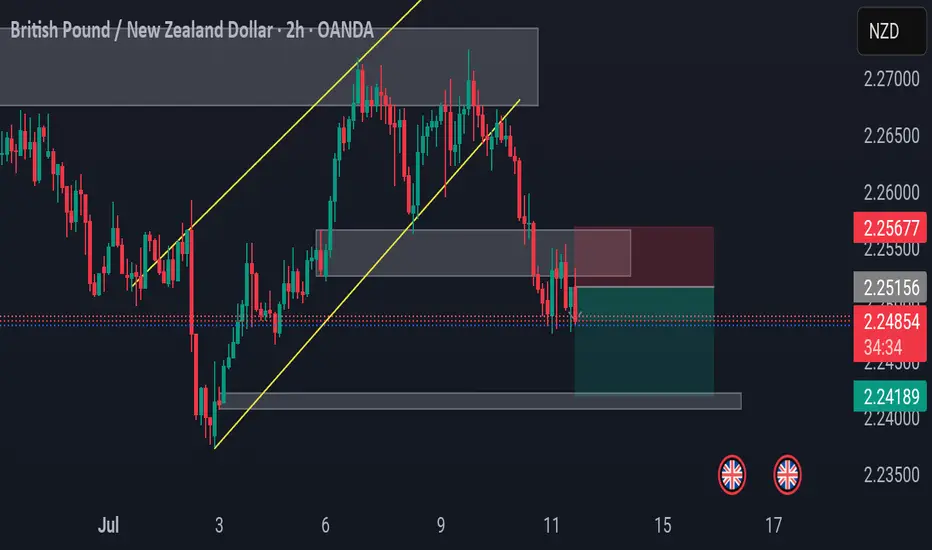
The recent structure break on GBP/NZD confirms bearish momentum, with price decisively rejecting the prior bullish channel (marked in yellow). After retesting the broken support zone (now acting as resistance), a clean supply zone formed around 2.25156 – 2.25677, where price has started to stall.
📌 Trade Setup:
Entry: 2.24902
SL: 2.25677 (Above supply)
TP: 2.24189 (Next demand zone)
This aligns with the overall trend shift as buyers failed to hold the previous structure. Expecting further downside toward the next demand zone unless bulls reclaim above 2.25677 with strong momentum.
---
✅ Confluence Highlights:
Break and retest of bullish channel
Supply zone confirmation
Bearish engulfing structure at resistance
Favorable risk-to-reward setup
📅 July 11, 2025
📊 Executed on: TradingView | OANDA Feed
#GBPNZD #Forex #PriceAction #SupplyDemand #BearishSetup #TradingView
GBP/NZD BEARISH BIAS RIGHT NOW| SHORT
Hello, Friends!
GBP-NZD uptrend evident from the last 1W green candle makes short trades more risky, but the current set-up targeting 2.251 area still presents a good opportunity for us to sell the pair because the resistance line is nearby and the BB upper band is close which indicates the overbought state of the GBP/NZD pair.
Disclosure: I am part of Trade Nation's Influencer program and receive a monthly fee for using their TradingView charts in my analysis.
✅LIKE AND COMMENT MY IDEAS✅

GBPNZD: One More Pullback Trade I notice another potentially profitable pullback trade opportunity on 📉GBPNZD.
The price formed a double top pattern after testing a significant daily/intraday resistance and has broken through its neckline.
Currently, we are witnessing a retest, and the pair could pull back to the 2.2391 level.

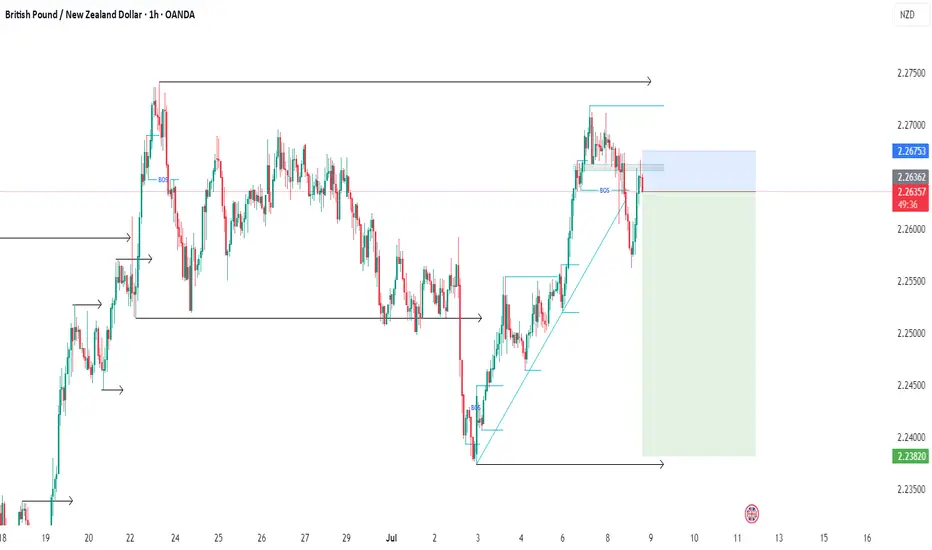
GBPNZD - Look for Long (SWING) 1:3GBPNZD currently shows no signs of reversal, having broken the trendline and heading toward the next supply zone on the higher timeframe. This presents a potential opportunity to go long in line with the prevailing trend, never trade against it. Let’s observe how the price action unfolds.
Disclaimer:
This is simply my personal technical analysis, and you're free to consider it as a reference or disregard it. No obligation! Emphasizing the importance of proper risk management—it can make a significant difference. Wishing you a successful and happy trading experience!


GBPNZD to find buyers at current market price?GBPNZD - 24h expiry
The medium term bias remains bullish.
We look for a temporary move lower. Preferred trade is to buy on dips.
Bespoke support is located at 2.2485.
Risk/Reward is ample to buy at market.
We look to Buy at 2.2485 (stop at 2.2430)
Our profit targets will be 2.2705 and 2.2730
Resistance: 2.2650 / 2.2740 / 2.2790
Support: 2.2500 / 2.2450 / 2.2410
Risk Disclaimer
The trade ideas beyond this page are for informational purposes only and do not constitute investment advice or a solicitation to trade. This information is provided by Signal Centre, a third-party unaffiliated with OANDA, and is intended for general circulation only. OANDA does not guarantee the accuracy of this information and assumes no responsibilities for the information provided by the third party. The information does not take into account the specific investment objectives, financial situation, or particular needs of any particular person. You should take into account your specific investment objectives, financial situation, and particular needs before making a commitment to trade, including seeking advice from an independent financial adviser regarding the suitability of the investment, under a separate engagement, as you deem fit.
You accept that you assume all risks in independently viewing the contents and selecting a chosen strategy.
Where the research is distributed in Singapore to a person who is not an Accredited Investor, Expert Investor or an Institutional Investor, Oanda Asia Pacific Pte Ltd (“OAP“) accepts legal responsibility for the contents of the report to such persons only to the extent required by law. Singapore customers should contact OAP at 6579 8289 for matters arising from, or in connection with, the information/research distributed.

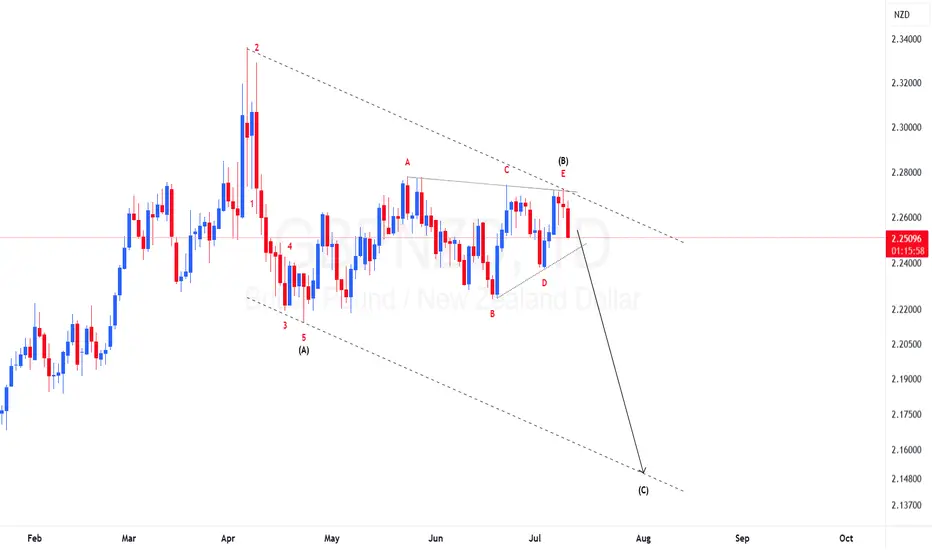
GBPNZD Elliot waves forecastPrice made impulsive move to the downside followed with a triangle correction, since triangles will only appear in 4th wave and as wave B or X in corrections then I am expecting price to continue to drop to complete this zigzag correction before resuming bullish momentum. To take advantage of the bearish move one should find area of resistance to short the market.
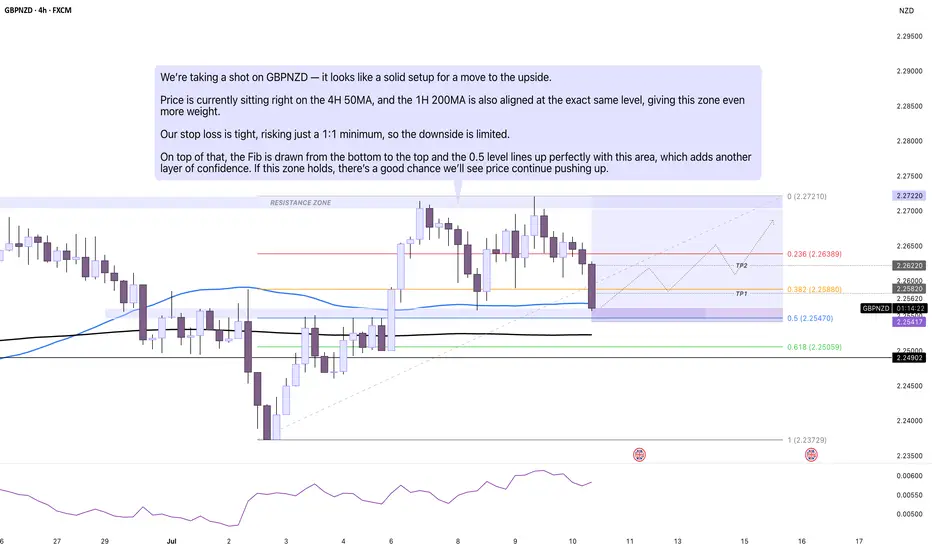
↓ Low Risk ↑ High Reward on GBPNZDGBPNZD looks like a solid setup for a move to the upside. Price is currently sitting right on the 4H 50MA, and the 1H 200MA is also aligned at the exact same level, giving this zone even more weight. Our stop loss is tight, risking just a 1:1 minimum, so the downside is limited. On top of that, the Fib is drawn from the bottom to the top and the 0.5 level lines up perfectly with this area, which adds another layer of confidence. If this zone holds, there’s a good chance we’ll see price continue pushing up.
GBPNZD | Potential Buy opportunityHey Traders!
We’re taking a shot on GBPNZD — it looks like a solid setup for a move to the upside. Price is currently sitting right on the 4H 50MA, and the 1H 200MA is also aligned at the exact same level, giving this zone even more weight. Our stop loss is tight, risking just a 1:1 minimum, so the downside is limited. On top of that, the Fib is drawn from top to bottom and the 0.5 level lines up perfectly with this area, which adds another layer of confidence. If this zone holds, there’s a good chance we’ll see price continue pushing up.

GBPNZD CUP and handle PatternGBPNZD is currently trading within a range-bound structure. The price was recently rejected from the resistance area near 2.2700, but found strong support at the 0.618 Fibonacci retracement level, indicating bullish interest at lower levels.
The pair has now formed a cup and handle pattern—typically a bullish continuation signal—which suggests a possible retest of the 2.2700 resistance zone in the near term.
A breakout above this level, if supported by volume and momentum, could signal the beginning of a larger upward move. Until then, the range remains intact, and traders may look for buying opportunities on dips, with stops below the handle's low.

GBPNZD RANGEDaily and H4 range. Price at resistance zone with possible H4 double top forming. Clear head and shoulder on M15. waiting for break below neckline to look for selling signals.
GBPNZD Set To Fall! SELL!
My dear subscribers,
This is my opinion on the GBPNZD next move:
The instrument tests an important psychological level 2.2694
Bias - Bearish
Technical Indicators: Supper Trend gives a precise Bearish signal, while Pivot Point HL predicts price changes and potential reversals in the market.
Target - 2.2568
My Stop Loss - 2.2759
About Used Indicators:
On the subsequent day, trading above the pivot point is thought to indicate ongoing bullish sentiment, while trading below the pivot point indicates bearish sentiment.
Disclosure: I am part of Trade Nation's Influencer program and receive a monthly fee for using their TradingView charts in my analysis.
———————————
WISH YOU ALL LUCK
GBPNZD A Fall Expected! SELL!
My dear subscribers,
This is my opinion on the GBPNZD next move:
The instrument tests an important psychological level 2.2683
Bias - Bearish
Technical Indicators: Supper Trend gives a precise Bearish signal, while Pivot Point HL predicts price changes and potential reversals in the market.
Target - 2.2655
About Used Indicators:
On the subsequent day, trading above the pivot point is thought to indicate ongoing bullish sentiment, while trading below the pivot point indicates bearish sentiment.
Disclosure: I am part of Trade Nation's Influencer program and receive a monthly fee for using their TradingView charts in my analysis.
———————————
WISH YOU ALL LUCK

GBPNZD CONTINUING THE UPTREND?Looking at the last week rejection off the previous swing high, i think the GBPNZD will move upwards or continue this uptrend up until atleast the level 2.30873. A by considering the previous rejections on the swing high.
Lingrid | GBPNZD Trend Continuation OpportunityThe price perfectly fulfilled my last idea . FX:GBPNZD is rebounding strongly after forming a Higher Low just above the key support at 2.2587, sustaining the bullish structure. The recent impulse leg broke out of the previous downward channel, and price is now stabilizing for a potential rally toward the 2.2900 resistance. If momentum sustains above the trendline retest area, we may see another wave toward the top of the resistance zone.
📈 Key Levels
Buy zone: 2.2580–2.2660 near support and trendline confluence
Buy trigger: breakout continuation above 2.2700 with bullish structure
Target: 2.2900 resistance zone, top of the current wave
Sell invalidation: drop below 2.2370 breaks the bullish market structure
💡 Risks
Failure to hold 2.2580 support could push price back toward 2.2370
Resistance around 2.2700–2.2750 may delay breakout if volume weakens
Broader rangebound conditions may trap early long positions
If this idea resonates with you or you have your own opinion, traders, hit the comments. I’m excited to read your thoughts!

GBPNZD SELLWe have officially gotten a change of trend as proven by the transition from a sequence of higher highs and higher lows to a lower low and lower high. Stacked on top of this sequence is a pullback for a retest of a key level confirming our setup.