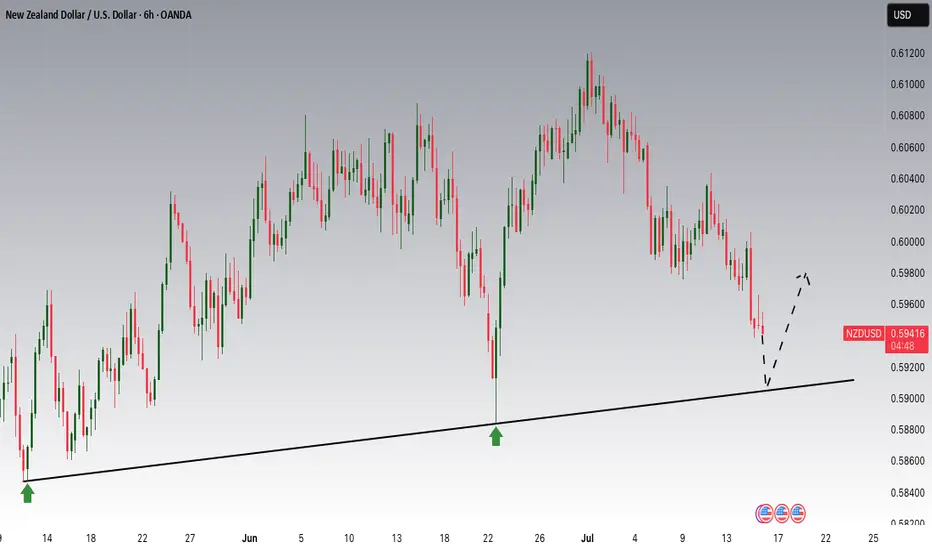
NZDUSD is Nearing an Important SupportHey Traders, in today's trading session we are monitoring NZDUSD for a buying opportunity around 0.59100 zone, NZDUSD is trading in an uptrend and currently is in a correction phase in which it is approaching the trend at 0.59100 support and resistance area.
Trade safe, Joe.
About New Zealand Dollar / U.S. Dollar
This pair is the New Zealand Dollar vs. the U.S. Dollar. It is often referred to as trading the “Kiwi” because the $1 coin depicts the Kiwi bird. In 2012 the Reserve Bank of New Zealand intervened to devalue the Kiwi because it had appreciated so much. It is the 10th most traded currency in the world.
Related currencies
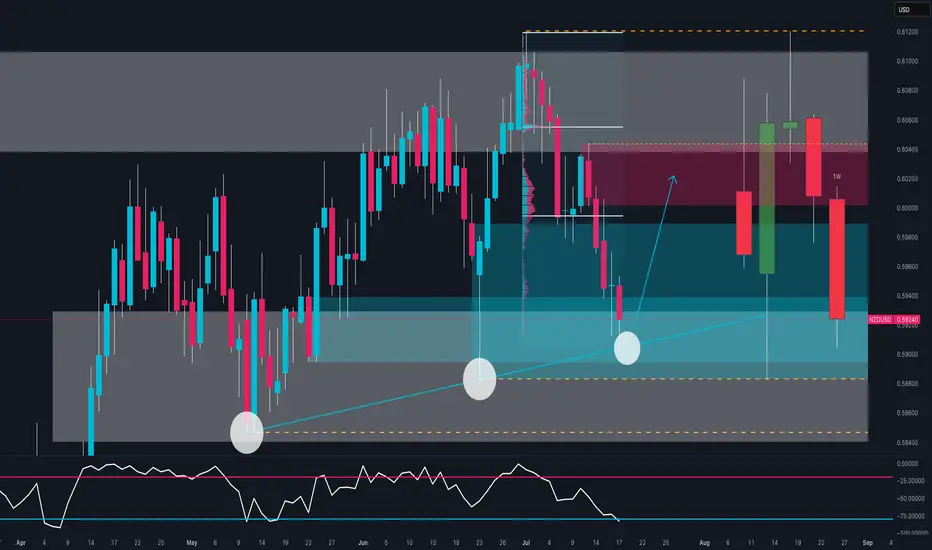
NZD/USD Ready to Explode? The Smart Money Is Making a MoveBias: Bullish Bounce from Key Demand Zone
NZD/USD is testing a strong confluence zone:
Long-term ascending trendline support
Weekly demand area between 0.5890 and 0.5940
Bullish RSI divergence near oversold conditions
The triple rejection wicks signal strong demand around 0.5900, suggesting a possib
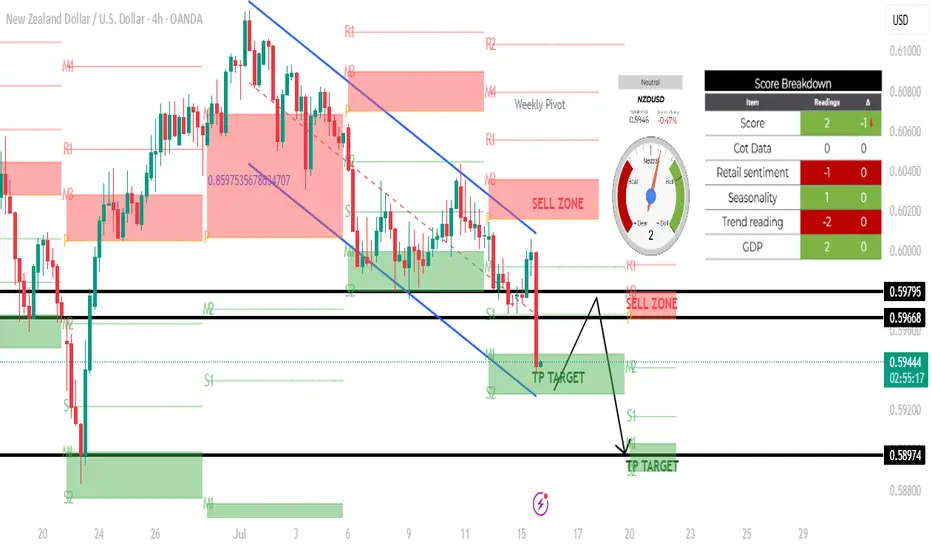
NZDUSD H4 SHORT SETUP: 15 JULY 2025Based on the 4-hour chart of NZD/USD, here's a technical analysis of the current setup:
\---
🕒 Timeframe: 4H
💱 Pair: NZD/USD
📉 Current Price: Around 0.59430
---
🔍 Chart Structure and Analysis:
🔻 Trend:
The market is in a clear downtrend, as indicated by the descending channel and the strong bea
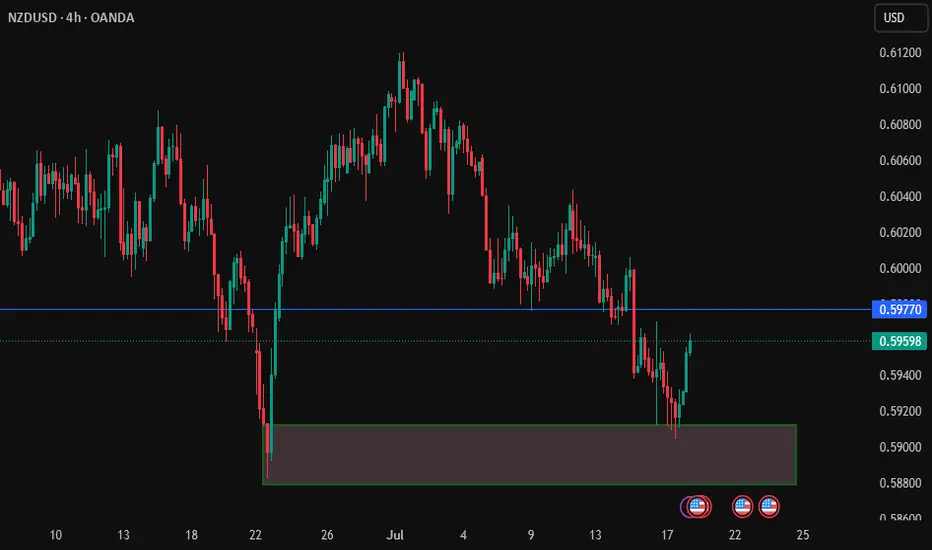
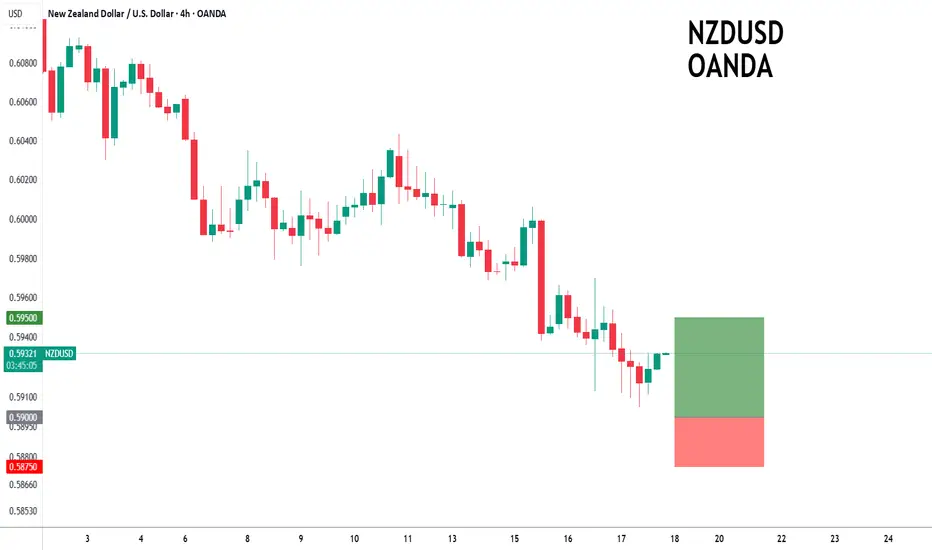
NZDUSD is bullishThe price just tapped into a valid order block.
This suggests a potential long (buy) opportunity.
We may see bullish momentum from this zone.
Watch for confirmation like bullish engulfing or BOS.
Place stop loss just below the order block.
Target the next resistance or liquidity zone.
Wait for entry
NZDUSD beating for a robust up move soon The coming weekdmight be a more volatile week for NZD, Stay put, I feel take out for long positions when you see the Opportunities.

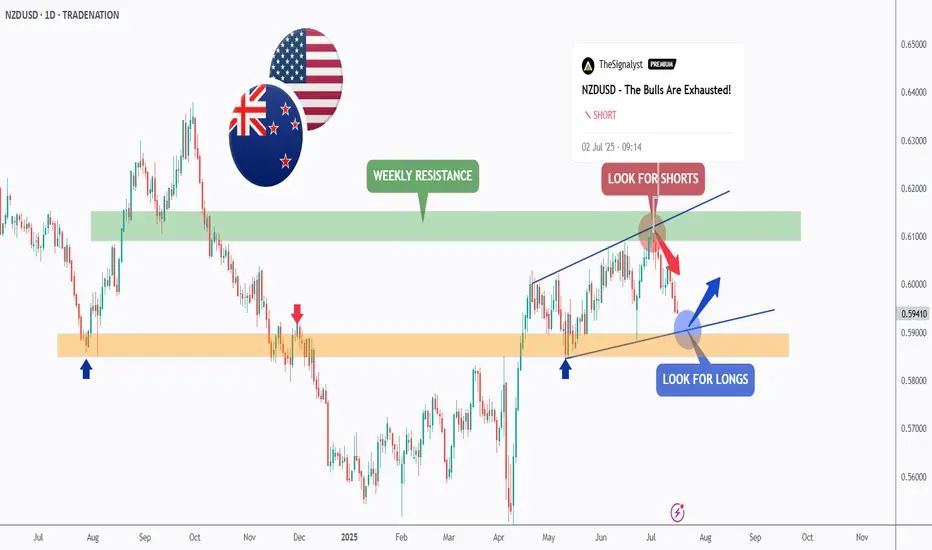
NZDUSD - It is Time!Hello TradingView Family / Fellow Traders. This is Richard, also known as theSignalyst.
As per our last NZDUSD analysis, attached on the chart, it rejected the upper bound of the blue wedge pattern and traded lower.
📈This week, NZDUSD is retesting the lower bound of the wedge.
Moreover, the ora
NZDUSD to turnaround?NZDUSD - 24h expiry
The correction lower is assessed as being complete.
We expect a reversal in this move.
Risk/Reward would be poor to call a buy from current levels.
A move through 0.5925 will confirm the bullish momentum.
The measured move target is 0.5975.
We look to Buy at 0.5900 (stop
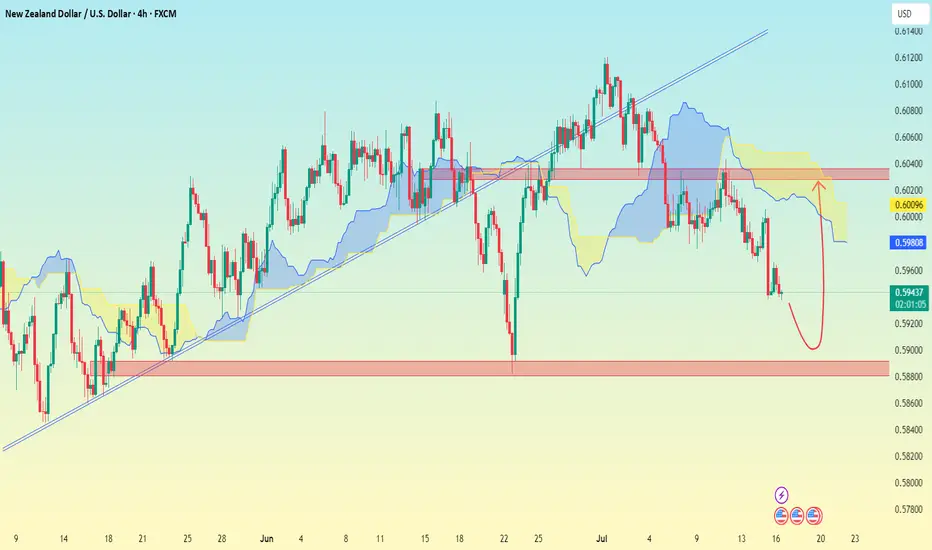
NZD/USD (4H time frame)..NZD/USD (4H time frame), here's the analysis:
---
📉 Chart Analysis Summary:
Price has broken below the trendline and is currently below the Ichimoku cloud, indicating bearish momentum.
A bearish move is likely continuing toward a strong support zone.
A rebound is drawn on my analysis suggestin
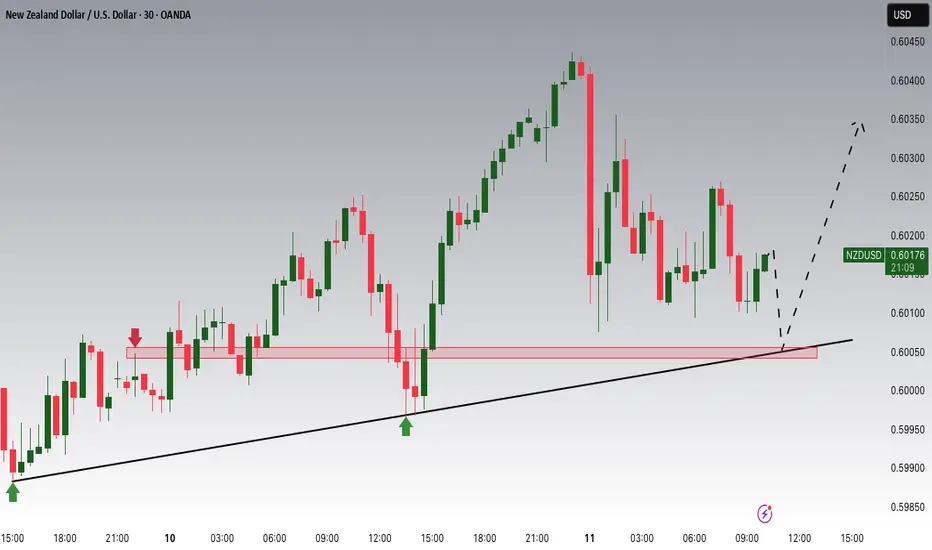
NZDUSD Potential UpsidesHey Traders, in today's trading session we are monitoring NZDUSD for a buying opportunity around 0.60000 zone, NZDUSD is trading in an uptrend and currently is in a correction phase in which it is approaching the trend at 0.60000 support and resistance area.
Trade safe, Joe.
NZDUSD H4 I Bearish Reversal Based on the H4 chart, the price is approaching our sell entry level at 0.5965, a pullback resistance that aligns with the 61.8% Fib retracement.
Our take profit is set at 0.5923, a pullback support.
The stop loss is set at 0.6004, a swing high resistance.
High Risk Investment Warning
Trading

See all ideas
Summarizing what the indicators are suggesting.
Oscillators
Neutral
SellBuy
Strong sellStrong buy
Strong sellSellNeutralBuyStrong buy
Oscillators
Neutral
SellBuy
Strong sellStrong buy
Strong sellSellNeutralBuyStrong buy
Summary
Neutral
SellBuy
Strong sellStrong buy
Strong sellSellNeutralBuyStrong buy
Summary
Neutral
SellBuy
Strong sellStrong buy
Strong sellSellNeutralBuyStrong buy
Summary
Neutral
SellBuy
Strong sellStrong buy
Strong sellSellNeutralBuyStrong buy
Moving Averages
Neutral
SellBuy
Strong sellStrong buy
Strong sellSellNeutralBuyStrong buy
Moving Averages
Neutral
SellBuy
Strong sellStrong buy
Strong sellSellNeutralBuyStrong buy
Displays a symbol's price movements over previous years to identify recurring trends.
Frequently Asked Questions
The current rate of NZDUSD is 0.59581 USD — it has increased by 0.51% in the past 24 hours. See more of NZDUSD rate dynamics on the detailed chart.
The value of the NZDUSD pair is quoted as 1 NZD per x USD. For example, if the pair is trading at 1.50, it means it takes 1.5 USD to buy 1 NZD.
The term volatility describes the risk related to the changes in an asset's value. NZDUSD has the volatility rating of 1.13%. Track all currencies' changes with our live Forex Heatmap and prepare for markets volatility.
The NZDUSD showed a −1.20% fall over the past week, the month change is a −0.54% fall, and over the last year it has decreased by −1.86%. Track live rate changes on the NZDUSD chart.
Learn how you can make money on rate changes in numerous trading ideas created by our community.
Learn how you can make money on rate changes in numerous trading ideas created by our community.
NZDUSD is a major currency pair, i.e. a popular currency paired with USD.
Currencies are usually traded through forex brokers — choose the one that suits your needs and go ahead. You can trade NZDUSD right from TradingView charts — just log in to you broker account. Check out the list of our integrated brokers and find the best one for your needs and strategy.
When deciding to buy or sell currency one should keep in mind many factors including current geopolitical situation, interest rates, and other. But before plunging into a deep research, you can start with NZDUSD technical analysis. The technical rating for the pair is neutral today, but don't forget that markets can be very unstable, so don't stop here. According to our 1 week rating the NZDUSD shows the neutral signal, and 1 month rating is sell. See more of NZDUSD technicals for a more comprehensive analysis.