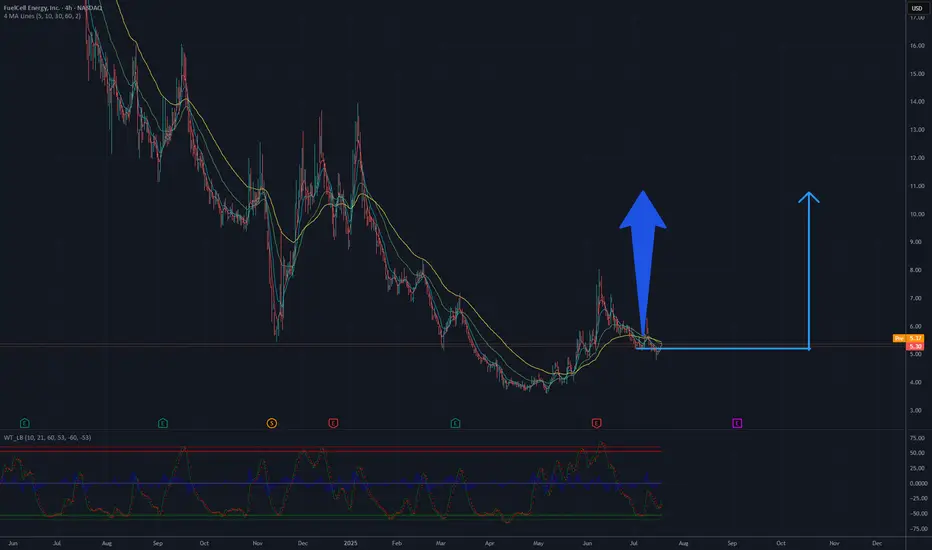
FCEL still relevant! 100% profit ! Potential TP: 11 USDTwo moving averages are visible (likely a short-term and a long-term one). The short-term one (yellow) crossed the long-term one (green) from below around May/June, which is typically a buy signal (golden cross). Currently, both moving averages show an upward trend, and the price is above them, conf
Next report date
—
Report period
—
EPS estimate
—
Revenue estimate
—
−7.42 USD
−126.01 M USD
112.13 M USD
22.71 M
About FuelCell Energy, Inc.
Sector
Industry
CEO
Jason B. Few
Website
Headquarters
Danbury
Founded
1969
FIGI
BBG000008973
FuelCell Energy, Inc. engages in the business of developing, designing, producing, constructing, and servicing high temperature fuel cells for clean electric power generation. It operates through the following geographical segments: the United States, South Korea, and Europe. The company was founded by Bernard Baker and Martin G. Klein in 1969 and is headquartered in Danbury, CT.
Related stocks
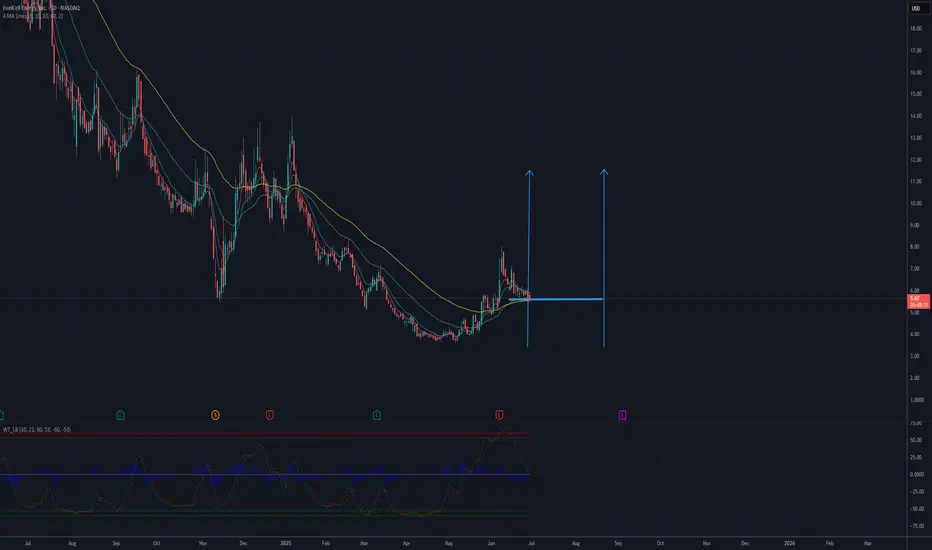
FCEL will back? 11 USD till September? Two moving averages are visible (likely a short-term and a long-term one). The short-term one (yellow) crossed the long-term one (green) from below around May/June, which is typically a buy signal (golden cross). Currently, both moving averages show an upward trend, and the price is above them, conf
KOREAN AIDaily weekly both look great, need to break this trend and get 7$ maybe a break out and retest of trend line to cool off the 4hr rsi or a plan ol rejection but the way small names are getting sent right makes me believe this is a decent possibility. Holding shares and a few 5 and 10 calls.

FCEL (LOG)Now that I have seen Log is more beneficial at assessing the long term routes of charts, I have applied it to FCEL
BOOM
Not financial advice

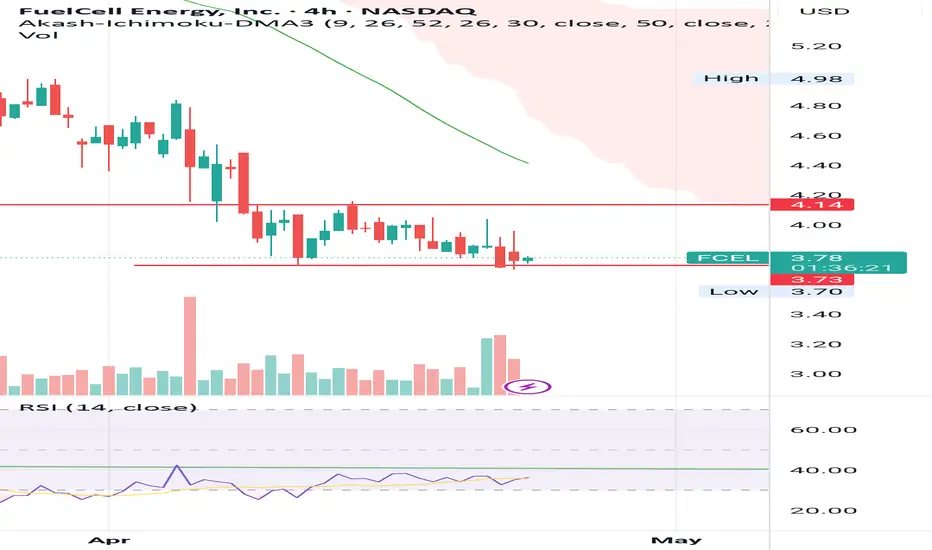
FCEL FuelCell Energy Options Ahead of EarningsAnalyzing the options chain and the chart patterns of FCEL FuelCell Energy prior to the earnings report this week,
I would consider purchasing the 5usd strike price Calls with
an expiration date of 2025-7-3,
for a premium of approximately $1.10.
If these options prove to be profitable prior to the e

Trade Setup Summary – Long Bias!🟢
Ticker: FCEL
Timeframe: 30-min chart
Current Price: $5.48
% Change: +39.09%
🔍 Technical Highlights
Price is breaking out of a wedge-like pattern, signaling bullish strength.
Breakout confirmation is marked at the yellow circle.
Volume is strong, indicating trader interest and momentum.
🎯 Trad

The cleanest if clean double bottoms incomingDouble bottoms everywhere but I especially like this on the monthly where the previous candle closed above the red support and the green current candle looks like it will close above it as well.
AMAZING! Just a shame at the pain many endured from this stock... ruthless world
Not financial advice


See all ideas
Summarizing what the indicators are suggesting.
Oscillators
Neutral
SellBuy
Strong sellStrong buy
Strong sellSellNeutralBuyStrong buy
Oscillators
Neutral
SellBuy
Strong sellStrong buy
Strong sellSellNeutralBuyStrong buy
Summary
Neutral
SellBuy
Strong sellStrong buy
Strong sellSellNeutralBuyStrong buy
Summary
Neutral
SellBuy
Strong sellStrong buy
Strong sellSellNeutralBuyStrong buy
Summary
Neutral
SellBuy
Strong sellStrong buy
Strong sellSellNeutralBuyStrong buy
Moving Averages
Neutral
SellBuy
Strong sellStrong buy
Strong sellSellNeutralBuyStrong buy
Moving Averages
Neutral
SellBuy
Strong sellStrong buy
Strong sellSellNeutralBuyStrong buy
Displays a symbol's price movements over previous years to identify recurring trends.
Curated watchlists where FCELB is featured.

Frequently Asked Questions
The current price of FCELB is 297.99 USD — it has decreased by −5.40% in the past 24 hours. Watch FuelCell Energy, Inc. stock price performance more closely on the chart.
Depending on the exchange, the stock ticker may vary. For instance, on OTC exchange FuelCell Energy, Inc. stocks are traded under the ticker FCELB.
FCELB stock has fallen by −8.31% compared to the previous week, the month change is a −5.18% fall, over the last year FuelCell Energy, Inc. has showed a −14.86% decrease.
FCELB reached its all-time high on Mar 11, 2014 with the price of 650.00 USD, and its all-time low was 24.00 USD and was reached on Jun 5, 2019. View more price dynamics on FCELB chart.
See other stocks reaching their highest and lowest prices.
See other stocks reaching their highest and lowest prices.
FCELB stock is 9.57% volatile and has beta coefficient of −0.03. Track FuelCell Energy, Inc. stock price on the chart and check out the list of the most volatile stocks — is FuelCell Energy, Inc. there?
Today FuelCell Energy, Inc. has the market capitalization of 107.57 M, it has decreased by −13.07% over the last week.
Yes, you can track FuelCell Energy, Inc. financials in yearly and quarterly reports right on TradingView.
FuelCell Energy, Inc. is going to release the next earnings report on Sep 4, 2025. Keep track of upcoming events with our Earnings Calendar.
FCELB earnings for the last quarter are −1.79 USD per share, whereas the estimation was −1.43 USD resulting in a −24.90% surprise. The estimated earnings for the next quarter are −1.44 USD per share. See more details about FuelCell Energy, Inc. earnings.
FuelCell Energy, Inc. revenue for the last quarter amounts to 37.41 M USD, despite the estimated figure of 32.44 M USD. In the next quarter, revenue is expected to reach 48.29 M USD.
FCELB net income for the last quarter is −38.05 M USD, while the quarter before that showed −28.33 M USD of net income which accounts for −34.33% change. Track more FuelCell Energy, Inc. financial stats to get the full picture.
Yes, FCELB dividends are paid quarterly. The last dividend per share was 12.50 USD. As of today, Dividend Yield (TTM)% is 0.00%. Tracking FuelCell Energy, Inc. dividends might help you take more informed decisions.
As of Aug 3, 2025, the company has 584 employees. See our rating of the largest employees — is FuelCell Energy, Inc. on this list?
EBITDA measures a company's operating performance, its growth signifies an improvement in the efficiency of a company. FuelCell Energy, Inc. EBITDA is −99.06 M USD, and current EBITDA margin is −105.65%. See more stats in FuelCell Energy, Inc. financial statements.
Like other stocks, FCELB shares are traded on stock exchanges, e.g. Nasdaq, Nyse, Euronext, and the easiest way to buy them is through an online stock broker. To do this, you need to open an account and follow a broker's procedures, then start trading. You can trade FuelCell Energy, Inc. stock right from TradingView charts — choose your broker and connect to your account.
Investing in stocks requires a comprehensive research: you should carefully study all the available data, e.g. company's financials, related news, and its technical analysis. So FuelCell Energy, Inc. technincal analysis shows the strong sell today, and its 1 week rating is strong sell. Since market conditions are prone to changes, it's worth looking a bit further into the future — according to the 1 month rating FuelCell Energy, Inc. stock shows the strong sell signal. See more of FuelCell Energy, Inc. technicals for a more comprehensive analysis.
If you're still not sure, try looking for inspiration in our curated watchlists.
If you're still not sure, try looking for inspiration in our curated watchlists.