Ivanhoe Mines - a 50% discount opportunity !The share price of this mining monster has suffered a 50% price decline in the last 6 months.
One of the main reasons for the share price decline is the suspension of underground operations at the Kakula mine due to seismic activity. This suspension has led to a withdrawal of production and cost gu
Next report date
—
Report period
—
EPS estimate
—
Revenue estimate
—
0.31 USD
217.18 M USD
38.86 M USD
718.64 M
About IVANHOE MINES LTD
Sector
Industry
CEO
Martie Cloete
Website
Headquarters
Vancouver
Founded
1993
FIGI
BBG003PGVH35
Ivanhoe Mines Ltd. is a mining development company engaged in the exploration and development of mineral properties. Its projects include the Platreef Project, Kamao-Kakula Project, Western Foreland Exploration Project, and Kipushi Project. The company was founded by Robert Martin Friedland on April 29, 1993 and is headquartered in Vancouver, Canada.
Related stocks

Looks like good set upPosted this for a follower on twitter:
I'm default bullish when price is over weekly EMA30. I've seen a lot of charts with this set up recently. If you think price can higher than all time highs (upcoming catalysts, macro), then buying anywhere here would be a good DCA starting point.
Lowest risk

$IVN Breaking Out!According to this simple Charting I'm starting to see a BreakOUT forming. Increased volume and 'momentum' is turning up.
I would love to hear your feedback on this? $IVN.TO

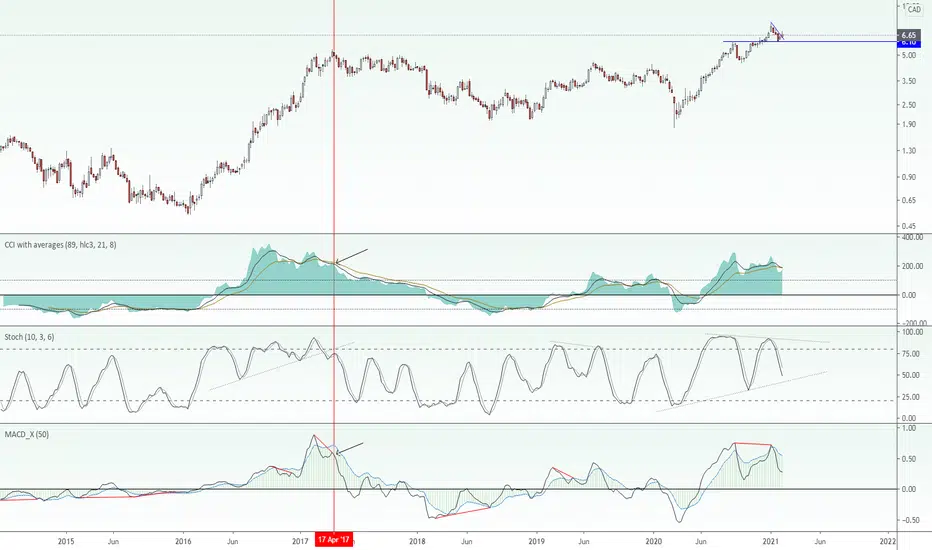
IVN on the move againAs you can see from my markups on the Daily chart, Ivanhoe Mines (#IVN) is on the on the move again however has a couple of major milestones to break through... As you can see we have two trend-lines we are approaching, one being a shorter term ascending trend-line, the other being a longer term des

Trade Idea: Buy Ivanhoe Mines (IVN)Buy at current levels (C$12.22) or better
Stop: C$11.30
Target: C$14.40

Trendlines Tell a Story... IVN Updates#IVN has been an interesting stock to trade with large swings to the upside and as well to the downside. HOWEVER non the less, we have been on an uptrend journey... For a very long time; since March 2020! BUT what about now? I'm showing some concern here for the longs out there as we can see some

Ivanhoe Mines - Minimum Retracement Almost ReachedInternational mining consultant Wood Mackenzie has ranked the Kamoa-Kakula Copper Project as the world's fourth-largest copper discovery, with copper grades that are the highest by a wide margin of the world's top 10 copper deposits.
The company has 3 principal projects in Southern Africa: the deve

IVNfinancing news out for the platinum nickel....mine platinum on the move also for used in power storage and nobody has been mining it for yrs and shortage.

Ivanhoetunnelled into new zone with super high grade copper. I believe they are sitting on a huge pile of cash . has ptm holdings also. daily showing perhaps bit drop to retest but just noise. Weekly simple system.
Power of Trend-Lines on IVN.TOHere is another case study of the Power of Trend-Line technical trading. If you start from the far left and work you way to the right, you will see where I have connected milestone price points and have created Trend-Line connecting points both on a larger macro time frame (in Yellow) and as well a

See all ideas
Summarizing what the indicators are suggesting.
Neutral
SellBuy
Strong sellStrong buy
Strong sellSellNeutralBuyStrong buy
Neutral
SellBuy
Strong sellStrong buy
Strong sellSellNeutralBuyStrong buy
Neutral
SellBuy
Strong sellStrong buy
Strong sellSellNeutralBuyStrong buy
An aggregate view of professional's ratings.
Neutral
SellBuy
Strong sellStrong buy
Strong sellSellNeutralBuyStrong buy
Neutral
SellBuy
Strong sellStrong buy
Strong sellSellNeutralBuyStrong buy
Neutral
SellBuy
Strong sellStrong buy
Strong sellSellNeutralBuyStrong buy
Displays a symbol's price movements over previous years to identify recurring trends.
Frequently Asked Questions
The current price of IVPAF is 7.32 USD — it has decreased by −4.68% in the past 24 hours. Watch Ivanhoe Mines Ltd. stock price performance more closely on the chart.
Depending on the exchange, the stock ticker may vary. For instance, on OTC exchange Ivanhoe Mines Ltd. stocks are traded under the ticker IVPAF.
IVPAF stock has fallen by −0.41% compared to the previous week, the month change is a −18.56% fall, over the last year Ivanhoe Mines Ltd. has showed a −43.65% decrease.
We've gathered analysts' opinions on Ivanhoe Mines Ltd. future price: according to them, IVPAF price has a max estimate of 16.58 USD and a min estimate of 8.82 USD. Watch IVPAF chart and read a more detailed Ivanhoe Mines Ltd. stock forecast: see what analysts think of Ivanhoe Mines Ltd. and suggest that you do with its stocks.
IVPAF reached its all-time high on May 21, 2024 with the price of 15.60 USD, and its all-time low was 0.36 USD and was reached on Jan 20, 2016. View more price dynamics on IVPAF chart.
See other stocks reaching their highest and lowest prices.
See other stocks reaching their highest and lowest prices.
IVPAF stock is 5.34% volatile and has beta coefficient of 2.74. Track Ivanhoe Mines Ltd. stock price on the chart and check out the list of the most volatile stocks — is Ivanhoe Mines Ltd. there?
Today Ivanhoe Mines Ltd. has the market capitalization of 9.92 B, it has increased by 1.45% over the last week.
Yes, you can track Ivanhoe Mines Ltd. financials in yearly and quarterly reports right on TradingView.
Ivanhoe Mines Ltd. is going to release the next earnings report on Aug 7, 2025. Keep track of upcoming events with our Earnings Calendar.
IVPAF earnings for the last quarter are 0.10 USD per share, whereas the estimation was 0.07 USD resulting in a 37.92% surprise. The estimated earnings for the next quarter are 0.04 USD per share. See more details about Ivanhoe Mines Ltd. earnings.
Ivanhoe Mines Ltd. revenue for the last quarter amounts to 77.02 M USD, despite the estimated figure of 88.94 M USD. In the next quarter, revenue is expected to reach 101.84 M USD.
IVPAF net income for the last quarter is 129.37 M USD, while the quarter before that showed 96.54 M USD of net income which accounts for 34.00% change. Track more Ivanhoe Mines Ltd. financial stats to get the full picture.
No, IVPAF doesn't pay any dividends to its shareholders. But don't worry, we've prepared a list of high-dividend stocks for you.
As of Jun 21, 2025, the company has 6 K employees. See our rating of the largest employees — is Ivanhoe Mines Ltd. on this list?
EBITDA measures a company's operating performance, its growth signifies an improvement in the efficiency of a company. Ivanhoe Mines Ltd. EBITDA is −95.98 M USD, and current EBITDA margin is −278.01%. See more stats in Ivanhoe Mines Ltd. financial statements.
Like other stocks, IVPAF shares are traded on stock exchanges, e.g. Nasdaq, Nyse, Euronext, and the easiest way to buy them is through an online stock broker. To do this, you need to open an account and follow a broker's procedures, then start trading. You can trade Ivanhoe Mines Ltd. stock right from TradingView charts — choose your broker and connect to your account.
Investing in stocks requires a comprehensive research: you should carefully study all the available data, e.g. company's financials, related news, and its technical analysis. So Ivanhoe Mines Ltd. technincal analysis shows the strong sell today, and its 1 week rating is sell. Since market conditions are prone to changes, it's worth looking a bit further into the future — according to the 1 month rating Ivanhoe Mines Ltd. stock shows the sell signal. See more of Ivanhoe Mines Ltd. technicals for a more comprehensive analysis.
If you're still not sure, try looking for inspiration in our curated watchlists.
If you're still not sure, try looking for inspiration in our curated watchlists.