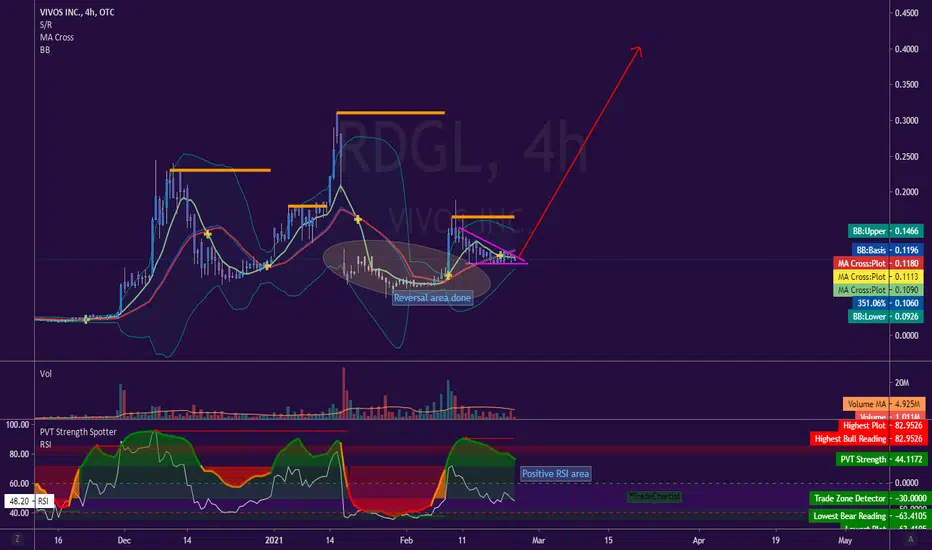
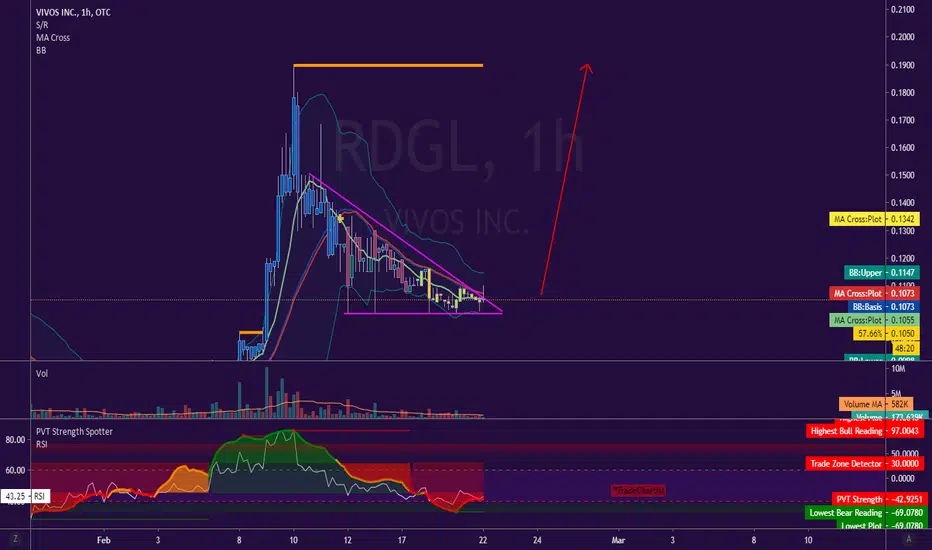
Aims for $0.40The reversal has already done, bullish pennant and RSI are still positive. It didn't sink yesterday as it has been correcting itself slowly.
I see $0.40 coming soon!
−0.0075 USD
−2.91 M USD
28.00 K USD
434.41 M
About Vivos Inc.
Sector
Industry
CEO
Michael K. Korenko
Website
Headquarters
Kennewick
Founded
1994
FIGI
BBG000BGYCD3
Vivos, Inc. is a radiation oncology medical device company. It is engaged in the development of its yttrium-90 based brachytherapy device, RadioGel, for the treatment of non-resectable tumors. The firm's product, RadioGel, is an injectable particle-gel for brachytherapy radiation treatment of cancerous tumors in people and animals. The company was founded by James C. Katzaroff on December 23, 1994 and is headquartered in Kennewick, WA.
Related stocks

$RDGL Vivos Inc; follow upWe've seen a major sell off but the floor held above a penny -- a good sign considering the amount of flippers and pump victims from ihub. With the conference this week vivid should gain some much needed exposure and perhaps make another substantial leap back in the green.

$RDGL Vivos Inc.; Sustained break from LT downtrend, bullishSet up a longer term chart with some future potential targets. You can see the chart supports fundamentals given recent company news, so this doesn't appear to be a pump or flash in the pan (as we saw two months ago). Looking very bullish in the near term and beyond.

$RDGL Vivos Inc.; New floor at ~025, leg up aheadLooking for a bounce tomorrow (10/4/18) towards new highs

$RDGL Vivos Inc: Moving north againSome more news is out today detailing the clinic chosen for sales of their product. This is setting up for a solid near-term run, as its basically churned through all outstanding shares and created a floor at .018ish. I think we'll see 0.04 soon

$RDGL Vivos looking STRONGSee previous for more detail -- just wanted a fresh chart w/ updated targets and a shorter interval.

$RDGL Vivos INC; clean break, big potentialI need to do more research before offering a formal opinion, but i bought for TA reasons at 0035 so i wanted to share the chart now that it's making a real move and the cancer drug they make is showing promise. Looks like we could see .01 before a pullback, but the volume is insane so who knows wher

See all ideas
Summarizing what the indicators are suggesting.
Oscillators
Neutral
SellBuy
Strong sellStrong buy
Strong sellSellNeutralBuyStrong buy
Oscillators
Neutral
SellBuy
Strong sellStrong buy
Strong sellSellNeutralBuyStrong buy
Summary
Neutral
SellBuy
Strong sellStrong buy
Strong sellSellNeutralBuyStrong buy
Summary
Neutral
SellBuy
Strong sellStrong buy
Strong sellSellNeutralBuyStrong buy
Summary
Neutral
SellBuy
Strong sellStrong buy
Strong sellSellNeutralBuyStrong buy
Moving Averages
Neutral
SellBuy
Strong sellStrong buy
Strong sellSellNeutralBuyStrong buy
Moving Averages
Neutral
SellBuy
Strong sellStrong buy
Strong sellSellNeutralBuyStrong buy
Displays a symbol's price movements over previous years to identify recurring trends.
Frequently Asked Questions
The current price of RDGL is 0.1225 USD — it has increased by 6.41% in the past 24 hours. Watch Vivos Inc. stock price performance more closely on the chart.
Depending on the exchange, the stock ticker may vary. For instance, on OTC exchange Vivos Inc. stocks are traded under the ticker RDGL.
RDGL stock has risen by 3.10% compared to the previous week, the month change is a −0.42% fall, over the last year Vivos Inc. has showed a −43.95% decrease.
RDGL reached its all-time high on Mar 27, 2007 with the price of 832.0000 USD, and its all-time low was 0.0065 USD and was reached on Jul 29, 2019. View more price dynamics on RDGL chart.
See other stocks reaching their highest and lowest prices.
See other stocks reaching their highest and lowest prices.
RDGL stock is 9.38% volatile and has beta coefficient of 1.37. Track Vivos Inc. stock price on the chart and check out the list of the most volatile stocks — is Vivos Inc. there?
Today Vivos Inc. has the market capitalization of 55.55 M, it has decreased by −3.62% over the last week.
Yes, you can track Vivos Inc. financials in yearly and quarterly reports right on TradingView.
RDGL net income for the last quarter is −834.70 K USD, while the quarter before that showed −1.02 M USD of net income which accounts for 18.42% change. Track more Vivos Inc. financial stats to get the full picture.
No, RDGL doesn't pay any dividends to its shareholders. But don't worry, we've prepared a list of high-dividend stocks for you.
As of Jun 22, 2025, the company has 1 employees. See our rating of the largest employees — is Vivos Inc. on this list?
EBITDA measures a company's operating performance, its growth signifies an improvement in the efficiency of a company. Vivos Inc. EBITDA is −2.89 M USD, and current EBITDA margin is −9.30 K%. See more stats in Vivos Inc. financial statements.
Like other stocks, RDGL shares are traded on stock exchanges, e.g. Nasdaq, Nyse, Euronext, and the easiest way to buy them is through an online stock broker. To do this, you need to open an account and follow a broker's procedures, then start trading. You can trade Vivos Inc. stock right from TradingView charts — choose your broker and connect to your account.
Investing in stocks requires a comprehensive research: you should carefully study all the available data, e.g. company's financials, related news, and its technical analysis. So Vivos Inc. technincal analysis shows the strong sell today, and its 1 week rating is neutral. Since market conditions are prone to changes, it's worth looking a bit further into the future — according to the 1 month rating Vivos Inc. stock shows the neutral signal. See more of Vivos Inc. technicals for a more comprehensive analysis.
If you're still not sure, try looking for inspiration in our curated watchlists.
If you're still not sure, try looking for inspiration in our curated watchlists.