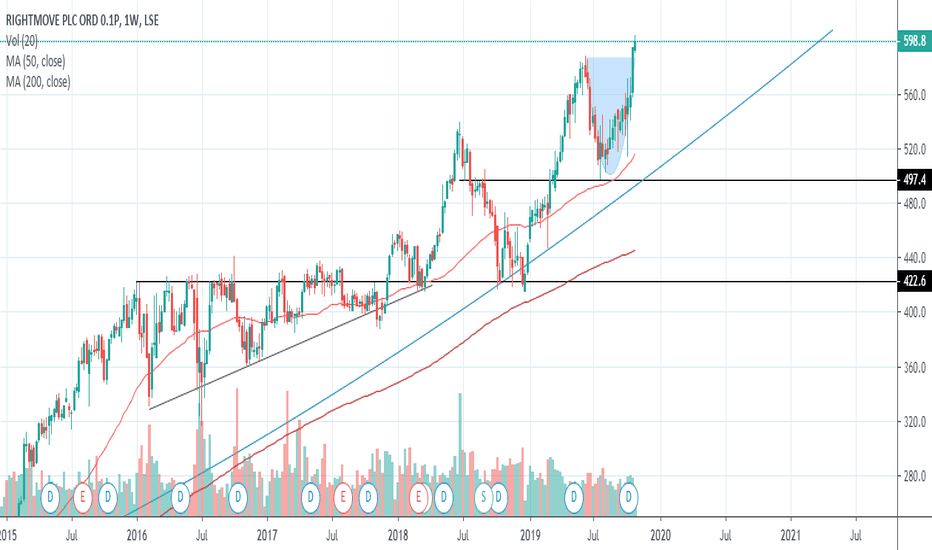
Rightmove Stock Quote | Chart & Forecast SummaryKey Indicators On Trade Set Up In General
1. Push Set Up
2. Range Set up
3. Break & Retest Set Up
Notes On Session
# Rightmove Stock Quote
- Double Formation
* A+ Set Up)) | Completed Survey | Subdivision 1
* 012345 | Valid Wave Count Configuration
- Triple Formation
* Retracement | Not Numbered |
0.62 USD
246.25 M USD
498.20 M USD
About RIGHTMOVE ORD GBP0.001
Sector
Industry
CEO
Dag Erik Johan Svanstrom
Website
Headquarters
Milton Keynes
Founded
2007
FIGI
BBG001MKSYC0
Rightmove Plc is engaged in the operation of property search platform. It operates through the following segments: Agency, New Homes, and Others. The Agency segment consists of resale and lettings property advertising services. The New Homes segment is focused on providing the property advertising services to new home developers and housing associations. The Others segment is involved in the overseas and commercial property advertising services and non-property advertising services. The company was founded by Reginald Stephen Shipperley on May 16, 2000 and is headquartered in London, the United Kingdom.
Related stocks
Rightmove Stock Analysis - London Market PlaceBased on the below fundamental analysis and technical analysis (breakout of resistance) the idea is to go long
Good news for property owners from the Halifax Index meant investor confidence grew in the market.
Shares in property portal Rightmove (RMV.L) surged on Friday as investors looked past a
Rightmove PLC 6 RRR shortTrading Methodology:
1. An asymmetric bullish/bearish pennant is drawn using ascending and descending curved trend lines with a minimum of three price action touche points per line. The direction is determined by the previous trend.
2. The angle tool is applied from the earliest two trend touch po
Rightmove Making The Right MovesLast post: June 14th. See chart .
Review: Price had started trending strong after breaking through resistance.
Update: Price continues to trend to the upside and still looks strong.
Conclusion: We will be looking for long opportunities following the next breakout.
Any comments or questions, d
See all ideas
Summarizing what the indicators are suggesting.
Oscillators
Neutral
SellBuy
Strong sellStrong buy
Strong sellSellNeutralBuyStrong buy
Oscillators
Neutral
SellBuy
Strong sellStrong buy
Strong sellSellNeutralBuyStrong buy
Summary
Neutral
SellBuy
Strong sellStrong buy
Strong sellSellNeutralBuyStrong buy
Summary
Neutral
SellBuy
Strong sellStrong buy
Strong sellSellNeutralBuyStrong buy
Summary
Neutral
SellBuy
Strong sellStrong buy
Strong sellSellNeutralBuyStrong buy
Moving Averages
Neutral
SellBuy
Strong sellStrong buy
Strong sellSellNeutralBuyStrong buy
Moving Averages
Neutral
SellBuy
Strong sellStrong buy
Strong sellSellNeutralBuyStrong buy
Displays a symbol's price movements over previous years to identify recurring trends.


