GWLC (Ohh I hate Resistances)GWLC is facing some trend line resistance shown in chart. Next expected resistance is also shown (~58.90).
Breaking it will move it up towards all time high (70).
Its my personal opinion, not a buy/sell call.
Next report date
—
Report period
—
EPS estimate
—
Revenue estimate
—
4.39 PKR
1.74 B PKR
18.17 B PKR
45.50 M
About GHARIBWAL CEMENT LTD
Sector
Industry
CEO
Muhammad Tousif Peracha
Website
Headquarters
Lahore
Founded
1960
ISIN
PK0005701013
FIGI
BBG000BK7GJ9
Gharibwal Cement Ltd. engages in the production and sale of cement. It produces ordinary portland cement. The company was founded on December 29, 1960 and is headquartered in Lahore, Pakistan.
Related stocks


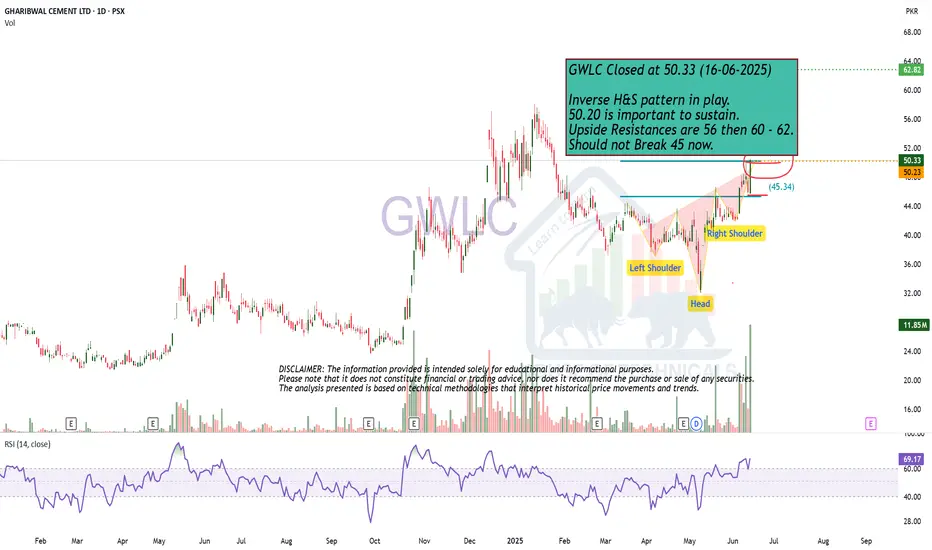
Inverse H&S pattern in play.GWLC Closed at 50.33 (16-06-2025)
Inverse H&S pattern in play.
50.20 is important to sustain.
Upside Resistances are 56 then 60 - 62.
Should not Break 45 now.
GWLC - About to have a breakoutGWLC tried to break its previous high but failed last time. Its again retesting it and hopefully will give breakout this time (48.35).
Then it may go to retest its all-time high (70). Ultimate target can be 132.
This is not a buy/sell call, just my own opinion.

Monthly closing above 43.10 would be a positive sign. GWLC-Closed at 42.95 (27-05-2025)
Monthly closing above 43.10 would be a
positive sign.
Weekly Closing should be above 42.
a Bullish Inverse H&S pattern is formed & it
would be valid only if 40.60 is not broken.
Upside targets (if 44.80 is Crossed), can be 50+

GWLC - PSX - SWING Trading Technical Analysis - Harmonic PatternOn Monthly TF, two harmonic patterns have been drawn. Gartley (94% complying) and Butterfly (88% complying).
In this bull run prices are moving way to fast. And due to market sentiments Bulls are in control. In normal bull run Gartley pattern will be complied before price drops but chances are that

GWLC is in Bullish ZoneGWLC is now above bearish zone and may be it will cross 45.3, 47.44 and 49.4 levels.
Stop loss 38.75
Note: This is not a buy/sell call.

Will Head & Shoulder Pattern play or not?Monthly Closing above 42 would be a
positive sign.
Weekly closing above 41.80 may lead
it towards 45.
H&S pattern is somewhat worrying. So,
unless 45-45.50 is crossed & Sustained, we
cannot expect further upside.

Is the Dow Theory Still in Play?First of all what is Dow Theory?
According to Dow Theory, it's all about Higher Highs (HH) and Higher Lows (HL) or Lower Highs (LH) & Lower Lows (LL). These the building blocks of an uptrend or downtrend respectively: (You can further google it) Together, a series of HHs and HLs suggests that the

GWLC is ready to flyGWLC is heading to 60 and 75
after breaking level of 50.
Currently at 42.31
Note: This is not a buy/sell call
Use stop loss whenever trade
Boost and follow me for more
updates.

See all ideas
Summarizing what the indicators are suggesting.
Oscillators
Neutral
SellBuy
Strong sellStrong buy
Strong sellSellNeutralBuyStrong buy
Oscillators
Neutral
SellBuy
Strong sellStrong buy
Strong sellSellNeutralBuyStrong buy
Summary
Neutral
SellBuy
Strong sellStrong buy
Strong sellSellNeutralBuyStrong buy
Summary
Neutral
SellBuy
Strong sellStrong buy
Strong sellSellNeutralBuyStrong buy
Summary
Neutral
SellBuy
Strong sellStrong buy
Strong sellSellNeutralBuyStrong buy
Moving Averages
Neutral
SellBuy
Strong sellStrong buy
Strong sellSellNeutralBuyStrong buy
Moving Averages
Neutral
SellBuy
Strong sellStrong buy
Strong sellSellNeutralBuyStrong buy
Displays a symbol's price movements over previous years to identify recurring trends.
Frequently Asked Questions
The current price of GWLC is 47.84 PKR — it has increased by 1.25% in the past 24 hours. Watch GHARIBWAL CEMENT LTD stock price performance more closely on the chart.
Depending on the exchange, the stock ticker may vary. For instance, on PSX exchange GHARIBWAL CEMENT LTD stocks are traded under the ticker GWLC.
GWLC stock has fallen by −1.81% compared to the previous week, the month change is a −2.96% fall, over the last year GHARIBWAL CEMENT LTD has showed a 64.97% increase.
GWLC reached its all-time high on Feb 20, 2017 with the price of 70.00 PKR, and its all-time low was 8.00 PKR and was reached on Jan 16, 2013. View more price dynamics on GWLC chart.
See other stocks reaching their highest and lowest prices.
See other stocks reaching their highest and lowest prices.
GWLC stock is 1.59% volatile and has beta coefficient of 1.46. Track GHARIBWAL CEMENT LTD stock price on the chart and check out the list of the most volatile stocks — is GHARIBWAL CEMENT LTD there?
Today GHARIBWAL CEMENT LTD has the market capitalization of 19.15 B, it has increased by 0.82% over the last week.
Yes, you can track GHARIBWAL CEMENT LTD financials in yearly and quarterly reports right on TradingView.
GHARIBWAL CEMENT LTD is going to release the next earnings report on Sep 3, 2025. Keep track of upcoming events with our Earnings Calendar.
GWLC net income for the last quarter is 469.13 M PKR, while the quarter before that showed 253.39 M PKR of net income which accounts for 85.15% change. Track more GHARIBWAL CEMENT LTD financial stats to get the full picture.
GHARIBWAL CEMENT LTD dividend yield was 0.00% in 2024, and payout ratio reached 0.00%. The year before the numbers were 0.00% and 0.00% correspondingly. See high-dividend stocks and find more opportunities for your portfolio.
As of Aug 2, 2025, the company has 381 employees. See our rating of the largest employees — is GHARIBWAL CEMENT LTD on this list?
EBITDA measures a company's operating performance, its growth signifies an improvement in the efficiency of a company. GHARIBWAL CEMENT LTD EBITDA is 4.28 B PKR, and current EBITDA margin is 22.38%. See more stats in GHARIBWAL CEMENT LTD financial statements.
Like other stocks, GWLC shares are traded on stock exchanges, e.g. Nasdaq, Nyse, Euronext, and the easiest way to buy them is through an online stock broker. To do this, you need to open an account and follow a broker's procedures, then start trading. You can trade GHARIBWAL CEMENT LTD stock right from TradingView charts — choose your broker and connect to your account.
Investing in stocks requires a comprehensive research: you should carefully study all the available data, e.g. company's financials, related news, and its technical analysis. So GHARIBWAL CEMENT LTD technincal analysis shows the neutral today, and its 1 week rating is buy. Since market conditions are prone to changes, it's worth looking a bit further into the future — according to the 1 month rating GHARIBWAL CEMENT LTD stock shows the buy signal. See more of GHARIBWAL CEMENT LTD technicals for a more comprehensive analysis.
If you're still not sure, try looking for inspiration in our curated watchlists.
If you're still not sure, try looking for inspiration in our curated watchlists.