Related currencies

Bullish Case for USD/SEK: A Technical PerspectiveOANDA:USDSEK showing strong reversal from key support at 9.60 level after major breakdown. Currently consolidating in the 9.60-9.70 zone with positive momentum building on multiple timeframes. This could be the start of a significant recovery after the sharp decline from 11.00 resistance. #Forex #U

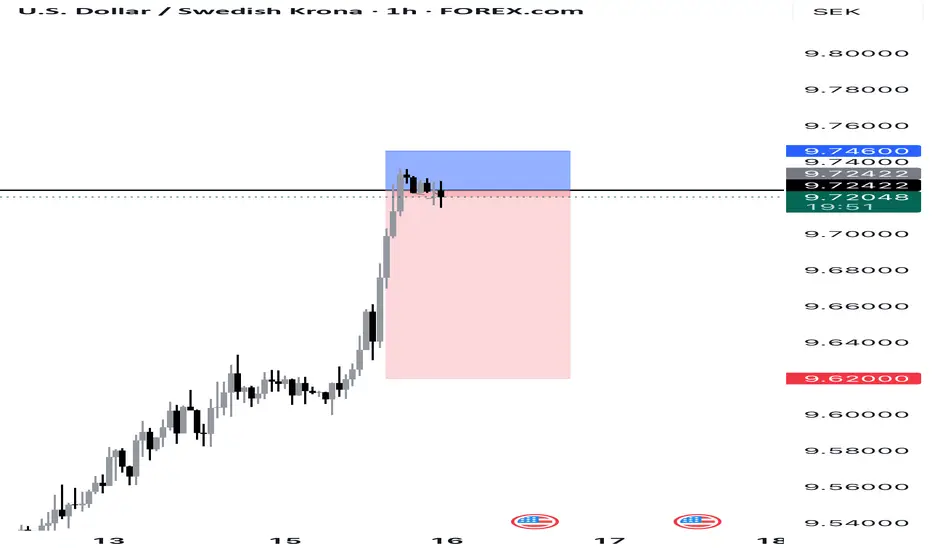
USDSEK SELLIt’s my first time trading this pair and I’m amazed at the beautiful price action and setup it’s delivered. I’ll be taking these shorts as it aligns with the daily and H4 whilst giving a complete 10/10 of my complete trading criteria. Let’s eat.
#010: USD/SEK SHORT Investment Opportunity
At the opening of the 8-hour candle, the price touched the 200-mark moving average with surgical precision on volume compression, signaling the exhaustion of the bullish movement underway since the end of June.
🔍 What strengthened the short position:
The price hit a key area defended by institut

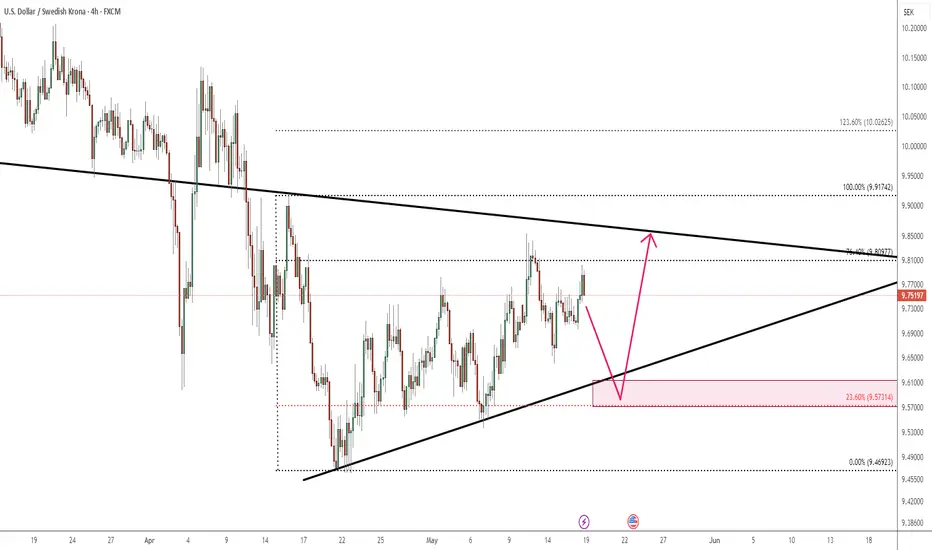
usdsek is in a trianglethe pair is now bouncing in a triangle and we predict to move further down before going up
trendline and fibo level for better understanding are drawn .
we are waiting for the result
USDSEK Bullish Breakout from Support📈 Overview from Weekly Time Frame
USDSEK is stalling at a key weekly support zone, showing signs of rejection from the downside. This level has acted as a reliable demand zone in the past.
📊 Daily Chart Explanation
Price has broken the internal bearish structure and is now holding firmly above t

Home of ABBA, IKEA, and Volvo (USD/SEK)USD/SEK has broken below major multi-year support.
While below there we are looking for shorts (i.e. bullish the Swedish krona)
The daily chart has corrected higher but the trend is down.
Another breakdown through the lows could setup another leg lower
Thoughts?

USDSEK | 21.04.2025BUY 9.53000 | STOP 9.44000 | TAKE 9.68000 | Technical view: oversold levels. Correctional return of the price.

USDSEK could jump 5%, learn why. With many top markets trading sideways, we explore USDSEK, which has gained 11% in recent weeks. Is it sustainable given global risks? Probably not. But how can we trade it? Watch the video to find out.
This content is not directed to residents of the EU or UK. Any opinions, news, research, analyse

Buy idea on USD/SEKBased on
- Cycle analysis and quantitative data
- Strong Demand Zone
- Undervalued Conditions

See all ideas
Summarizing what the indicators are suggesting.
Oscillators
Neutral
SellBuy
Strong sellStrong buy
Strong sellSellNeutralBuyStrong buy
Oscillators
Neutral
SellBuy
Strong sellStrong buy
Strong sellSellNeutralBuyStrong buy
Summary
Neutral
SellBuy
Strong sellStrong buy
Strong sellSellNeutralBuyStrong buy
Summary
Neutral
SellBuy
Strong sellStrong buy
Strong sellSellNeutralBuyStrong buy
Summary
Neutral
SellBuy
Strong sellStrong buy
Strong sellSellNeutralBuyStrong buy
Moving Averages
Neutral
SellBuy
Strong sellStrong buy
Strong sellSellNeutralBuyStrong buy
Moving Averages
Neutral
SellBuy
Strong sellStrong buy
Strong sellSellNeutralBuyStrong buy
Displays a symbol's price movements over previous years to identify recurring trends.
Frequently Asked Questions
The current rate of SEKUSD is 0.1032 USD — it has increased by 1.47% in the past 24 hours. See more of SEKUSD rate dynamics on the detailed chart.
The value of the SEKUSD pair is quoted as 1 SEK per x USD. For example, if the pair is trading at 1.50, it means it takes 1.5 USD to buy 1 SEK.
The term volatility describes the risk related to the changes in an asset's value. SEKUSD has the volatility rating of 1.67%. Track all currencies' changes with our live Forex Heatmap and prepare for markets volatility.
The SEKUSD showed a −1.15% fall over the past week, the month change is a −1.34% fall, and over the last year it has increased by 11.21%. Track live rate changes on the SEKUSD chart.
Learn how you can make money on rate changes in numerous trading ideas created by our community.
Learn how you can make money on rate changes in numerous trading ideas created by our community.
Currencies are usually traded through forex brokers — choose the one that suits your needs and go ahead. You can trade SEKUSD right from TradingView charts — just log in to you broker account. Check out the list of our integrated brokers and find the best one for your needs and strategy.
When deciding to buy or sell currency one should keep in mind many factors including current geopolitical situation, interest rates, and other. But before plunging into a deep research, you can start with SEKUSD technical analysis. The technical rating for the pair is neutral today, but don't forget that markets can be very unstable, so don't stop here. According to our 1 week rating the SEKUSD shows the buy signal, and 1 month rating is neutral. See more of SEKUSD technicals for a more comprehensive analysis.