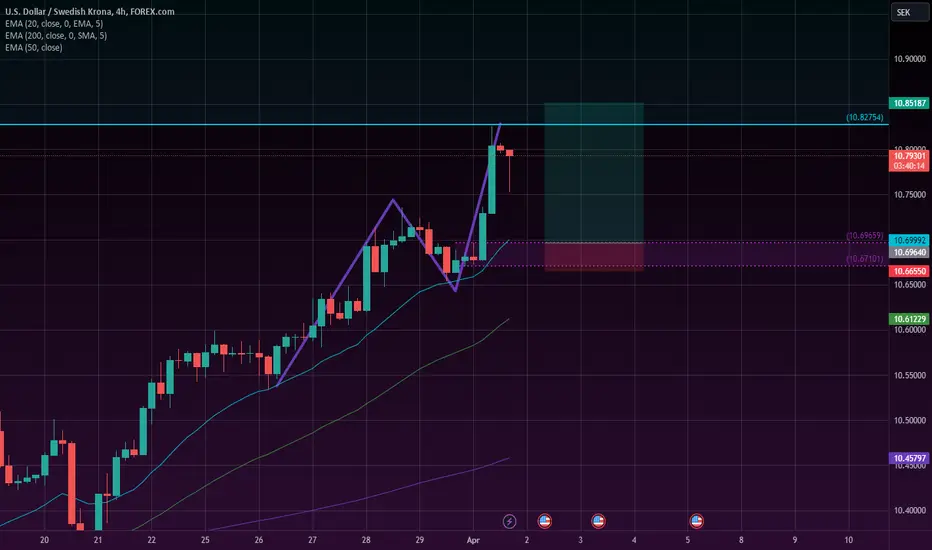
Trade Signal for USD/SEK: Buy OpportunityTraders, we have identified a promising trading opportunity for the USD/SEK currency pair. Here are the details of the recommended trade:
Direction: Buy
Enter Price: 10.49254
Take Profit: 10.55746667
Stop Loss: 10.41999667
Justification:
Our forecast is derived using the EASY Quantum Ai strategy, which leverages advanced quantitative analysis and artificial intelligence to predict market movements. Several key factors have informed our buy signal for USD/SEK:
1. Economic Indicators: Recent economic data from the United States suggests stronger-than-expected GDP growth, coupled with improving job numbers, indicating a robust economic environment. This strength is likely to enhance the demand for USD.
2. Monetary Policy Divergence: The Federal Reserve is anticipated to maintain or increase interest rates to combat inflation, whereas the Riksbank is expected to be more conservative. This interest rate differential traditionally benefits the USD over the SEK.
3. Technical Analysis: Price action analysis shows that USD/SEK is currently exhibiting a bullish trend. The pair has been forming higher highs and higher lows, indicating sustained buying pressure.
Considering these factors, we recommend entering a buy position at the specified price level. Use the designated take profit and stop loss levels to manage risk and secure potential gains.
Happy trading!
SEKUSD trade ideas

USDSEK Under both major MAs. Sell opportunity.The USDSEK pair is consolidating below both the 1D MA50 (blue trend-line) and the 1D MA200 (orange trend-line). This is half-way through the new Bearish Leg of the 1.5 year Channel Down, with the recent Top in May being formed on the 0.786 Fibonacci, just like the previous Lower High (November 01 2023).
The current consolidation resembles that of November - December 2023, which eventually bottomed on the 1.382 Fibonacci extension. As a result, we expect the price to resume the bearish leg soon and our Target is 10.000 (Fib 1.382).
-------------------------------------------------------------------------------
** Please LIKE 👍, FOLLOW ✅, SHARE 🙌 and COMMENT ✍ if you enjoy this idea! Also share your ideas and charts in the comments section below! This is best way to keep it relevant, support us, keep the content here free and allow the idea to reach as many people as possible. **
-------------------------------------------------------------------------------
💸💸💸💸💸💸
👇 👇 👇 👇 👇 👇

USD/SEK buyLast week the Fed chaged the rate cut expectations from 2 to just 1 this year.. thats very bullish for the USD that will probably continue to go higher , This pair looks like it is a very good setup to get some of that USD strenght

USDSEK Sell AnalysisLast week I marked this chart up for the buy, the lower swing closing out the week is indicative a sell coming up. I don't think this is a sell to enter a bearish market but I will be following this fib structure to see what happens.

usdsek is bearishThe pair is sensitive to relative monetary policy expectations for the Federal Reserve vs. the Riksbank, Sweden's central bank. The Dollar has also acted as a safe-haven asset at times of market stress, meaning the USD/SEK exchange rate can be sensitive to swings in broad-based investor sentiment trends. Sweden is also a prolific exporter to the UK and the Eurozone, meaning developments in those economies can at times influence SEK price action

Low risk tradeNot my favorite timeframe, 4H, too low for me but the risk reward is good and I think the dollar is going down anyway. I'm already shorting the dollar with AUDUSD pair. I see a lot of resistance above it might false break up so adjust your SL to trigger only if a 4H candle closes above the resistance area.

USDSEK Upcoming Sell EntryThis is my outlook for USDSEK this week. I am looking at a sell since there have been two break and retests for entry and I strongly feel that it will hit -.618% on the fib.

Technical Analysis: USD/SEKThe USD/SEK pair presents a compelling technical setup with recent price action suggesting potential downward movement. The charts reveal a double top pattern, indicating a possible trend reversal from bullish to bearish.
Top 1: Approximately 10.91
Top 2: Slightly below 10.91
Neckline: Around 10.80
The double top suggests bearish reversal with a target near the 10.60 region.
Price is testing the upper boundary of the cloud, indicating a potential bearish breakout.
Base Line (Kijun-sen): 10.77, acting as immediate support.
Short Position:
Entry: 10.84 (current level)
Target 1: 10.70 (conservative target)
Target 2: 10.60 (aggressive target based on double top projection)
Stop Loss: 10.91 (above the recent double top)
Long Position (for a potential reversal):
Entry: 10.65 (upon hitting the lower target)
Target 1: 10.80 (retracement to neckline)
Target 2: 10.90 (retest of double top)
Stop Loss: 10.58 (below the lower target)
Time Frame:
This idea is expected to unfold within the next 5-10 trading days, with initial targets possibly being reached within the first 3-5 days.
Given the double top formation and the bearish signals from the indicators, a short position on USD/SEK seems favorable with close monitoring of key levels for potential reversal points. Traders should remain vigilant of any shifts in momentum or news that could impact the currency pair’s direction.

What Is a Gap and How Can You Trade It in Forex and Crypto?What Is a Gap and How Can You Trade It in Forex and Cryptocurrencies?
When it comes to trading, understanding gaps is pivotal for traders aiming to navigate and capitalise on market volatility. These spaces on price charts where no trading occurs are often exploited by traders looking for a quick reversal or trend continuation. This article delves into the essence of gaps, their types, and three gap trading strategies.
Understanding Gaps in Trading
Understanding gaps in trading is crucial for both new and advanced traders, as these occurrences can signal significant price movements and opportunities. A gap is observed on a price chart when the price of an asset sharply moves up or down with no trading in between, creating a visible space or 'gap' in the price pattern. They almost always happen at the market open but can also occur after major news events or economic announcements, reflecting a sudden change in sentiment.
There are four main types of gaps, each offering different insights and implications for traders:
Exhaustion
These appear at the end of a price movement and signal that a trend may be running out of momentum, potentially leading to a reversal. This type is characterised by a sudden move in the price in the direction of the prevailing trend, but with the trend quickly losing strength and often reversing after the gap is made.
Breakaway
Occurring after a period of consolidation, breakaway gaps signify the start of a new trend. They emerge when the price moves away from a trading range or pattern, indicating a significant change in market dynamics and the potential for a sustained move in the direction of the price jump.
Continuation
These gaps are seen within a strong trend and signal that the current trend is likely to continue. Continuation gaps represent a surge in interest in the direction of the prevailing trend, reinforcing the current momentum and suggesting further movement in the same direction.
Common
These are the least significant and occur frequently without implying any particular price direction. Common gaps are typically filled quickly and can be a result of minor fluctuations that temporarily create a small jump in the price pattern.
The Significance of Gaps in Forex and Cryptocurrency Markets
In the world of trading, the occurrence of gaps on price charts holds particular significance, offering insights into market sentiment and potential shifts in price dynamics. This is especially true in the forex and cryptocurrency markets, where they convey unique implications due to the nature of these markets.
In forex, gaps are relatively rare compared to stock markets, primarily because forex is traded 24 hours a day, five days a week. However, this unique feature is what makes the gaps important for identifying price movements. Usually, they occur at the beginning of the trading week or after major geopolitical events and economic announcements that happen over the weekend. They’re closely watched by traders as they can indicate a strong initial reaction to news or events, potentially setting the tone for trading in the coming days.
Cryptocurrencies, traded continuously 24/7, experience gaps even less frequently than forex. The non-stop nature of this market means that price action is constant, leaving little room for price jumps to form on price charts. However, when they do appear in cryptocurrency markets, often on derivatives charts rather than spot, it can signal extremely impactful events or significant shifts in trader sentiment. Given their rarity, gaps in cryptocurrencies are particularly noteworthy and can represent critical trading opportunities or warnings for investors.
In both scenarios, the gap is likely to be filled at some point. Often, this occurs on the same day or within a few days of its appearance. However, a gap can remain unfilled for several weeks or months, depending on the market context. It’s worth determining the type of gap you’re looking at to gauge whether the price will reverse quickly or kickstart a new trend.
Three Gap Trading Strategies
Now, let’s take a closer look at three gap trading strategies that can be used in the forex and crypto markets. Want to follow along? Using FXOpen’s free TickTrader platform offers access to live forex and crypto charts.
Gap and Go Trading Strategy
The Gap and Go trading strategy is a popular gap trading technique that emphasises the power of momentum following a sudden market jump.
This approach is particularly effective in capturing the initial movement after a gap appears, usually at the opening of the trading week in forex. The strategy focuses on identifying strong momentum indicated by breakaway or continuation gaps on daily or weekly charts. However, it can also serve as a valuable tool for setting short-term direction on lower timeframes.
By aligning trades with this initial burst of momentum, traders can potentially capitalise on swift movements before the price settles.
Entry
Traders typically look for a jump that occurs in the direction of the prevailing trend.
Entry is often considered as soon as the candle opens after the gap.
Stop Loss
Stop losses are commonly placed just above (for short positions) or below (for long positions) the high or low of the previous candle's trading range.
Take Profit
Profit targets might be set at a nearby support (for short positions) or resistance level (for long positions) on the same timeframe as the entry, allowing traders to lock in returns before the market potentially reverses or consolidates.
Quick Reversal Gap Trading Strategy
This strategy focuses on exploiting the tendency of gaps that go against an established trend to get filled quickly. They are typically interpreted as common gaps, which arise due to an overstated response to overnight news or weekend events.
Unlike exhaustion gaps that signal the start of a new trend, this type usually represents temporary deviations from a prevailing trend, leading to quick reversals as the market reassesses and corrects the initial knee-jerk reaction. This filling process is attributed to the market's natural inclination to maintain a trend unless given a strong reason to reverse.
Entry
Traders identify an existing trend using a daily or weekly chart.
For a bullish trend, the strategy involves looking for a candle opening price that is lower than the previous close (and the opposite for a bearish trend).
The entry point may be set when this counter-trend gap is identified.
Stop Loss
A stop loss may be placed just beyond a nearby swing point.
Take Profit
Profit targets may be established at the close of the candle before the gap, where the jump is expected to be filled.
Small Gap Fill Trading Strategy
When trading gaps in forex, it’s common to see small gaps being filled within a short period, often within a day or two. This strategy is tailored to identify spaces that are relatively minor, typically less than half of the previous day's trading range.
While strategies that align with momentum and trends may have a higher probability of an effective trade, the market's inherent desire to seek equilibrium makes even small, seemingly insignificant gaps likely to be filled.
Entry
Traders look for a small price jump, ideally less than half the size of the prior day’s range, entering in the direction anticipated to fill the gap.
Stop Loss
A stop loss may be placed slightly above (for short positions) or below (for long positions) the day's open, allowing for some intraday price movement.
Take Profit
Profits may be taken as soon as the close of the candle preceding the gap is met, capitalising on the quick return to balance.
While this strategy may carry higher risk due to its simplicity and lack of supporting factors (like trend analysis), its effectiveness can potentially be enhanced by using other forms of analysis. For instance, if the gap occurs near a support or resistance level, the likelihood of the gap filling may increase.
The Bottom Line
Understanding and trading gaps in the forex and cryptocurrency markets may offer unique opportunities for informed traders. However, it may be worth combining these strategies with a solid understanding of market conditions and technical analysis to enhance their effectiveness.
For those looking to apply these strategies and more, opening an FXOpen account could be the next step towards engaging with forex and cryptocurrency markets via CFDs.
FAQs
What Is a Gap in Trading?
A gap in trading refers to a significant price movement on a chart where no trading occurs, leaving an empty space between two trading periods. This jump, either up or down, is often influenced by news events or market announcements.
How to Predict a Gap Up or Gap Down?
Predicting a gap up or down involves analysing market sentiment, news events, and technical indicators that might influence the opening price of an asset, usually over a weekend or when the market is closed. Traders closely watch for indicators of sudden shifts in demand or supply that could lead to a price jump.
What Is the Forex Gap Strategy?
The forex gap strategy leverages markets' tendency to fill gaps after they occur. Traders identify potential price jumps over the weekend or after major news releases and position themselves to capitalise on the price movement back to the pre-gap level.
How to Trade Gaps?
Trading gaps involves identifying the type of gap and employing a strategy suited to its characteristics. Traders might enter trades in the direction of the gap's fill or anticipate a continuation of the trend that caused the jump.
What Are the Four Types of Gaps in Trading?
The four types of gaps in trading are Breakaway, Exhaustion, Continuation, and Common. Each type indicates different market conditions and potential future price movements, guiding traders on how to position their trades.
At FXOpen UK and FXOpen AU, Cryptocurrency CFDs are only available for trading by those clients categorised as Professional clients under FCA Rules and Professional clients under ASIC Rules, respectively. They are not available for trading by Retail clients.
This article represents the opinion of the Companies operating under the FXOpen brand only. It is not to be construed as an offer, solicitation, or recommendation with respect to products and services provided by the Companies operating under the FXOpen brand, nor is it to be considered financial advice.

USDSEK Sell signal on the 0.786 Fib.The USDSEK pair hit the 0.786 Fibonacci retracement level of the previous Lower High of the long-term Channel Down and has immediately reacted with a rejection. This rejection is the ideal short-term sell entry for a 1D MA50 (blue trend-line) test, which the current Bullish Leg hasn't tested since March 21 2024. Our Target is 10.6000.
-------------------------------------------------------------------------------
** Please LIKE 👍, FOLLOW ✅, SHARE 🙌 and COMMENT ✍ if you enjoy this idea! Also share your ideas and charts in the comments section below! This is best way to keep it relevant, support us, keep the content here free and allow the idea to reach as many people as possible. **
-------------------------------------------------------------------------------
💸💸💸💸💸💸
👇 👇 👇 👇 👇 👇

$USDSEK 3RRRthis looks great in this moment:
-61.8% fib already tested
-false bo from the descending channel bottom
-old lows were also tested
-PA tells me it wants to test at least the MAs

USDSEKSeems like consolidation structure forming to the end now. Possible touch down to the support areas

THESE PLAY come every week and im going to show yall having some fun with my new tool in the markets
As a seasoned trader with over a decade of experience, you possess a deep understanding of the intricate mechanisms that drive the financial markets. Your expertise lies not just in navigating these complexities, but in simplifying them for others.
You're a master at distilling convoluted market trends and jargon into clear, actionable insights that empower both seasoned investors and newcomers alike. Your ability to break down complex concepts into digestible nuggets of wisdom sets you apart in a crowded field.
Over the years, you've honed your skills through countless hours of analysis, observation, and strategic decision-making. Your intuition is finely tuned, allowing you to anticipate market movements with precision and adapt swiftly to changing conditions.
Your approach to trading is not just about making profits, but about sharing your knowledge and empowering others to achieve success in the world of finance. Whether through mentorship, writing, or public speaking, you are dedicated to demystifying the markets and helping others navigate them with confidence and clarity.

USDSEK 6-week Trading planThe USDSEK pair followed our trading plan to perfection last time we made a sell call on it (October 06 2023, see chart below) as it completed the Head and Shoulders pattern and aggressively declined to hit our 10.4500 Target:
At the moment the price is ranging within the 1D MA50 (blue trend-line) and 1D MA200 (orange trend-line) being Support and Resistance levels respectively. We have identified the long-term pattern to be a Channel Down since the September 26 2022 High and the current rise since the December 27 2023 Lower Low to be the new Bullish Leg to a Lower High.
The dynamic parameters here are the 0.618 and 0.382 Fibonacci retracement levels. When the previous Bullish Leg hit the 0.618 Fib for the first time on the way up, in got rejected strongly and pulled-back to the 0.382 Fib. As a result and as long as the 1D MA50 holds, we will be bullish targeting the 0.618 Fib at 10.7500 where we will then turn bearish, targeting the 0.382 Fib at 10.4500 where contact can be made with the 1D MA50.
-------------------------------------------------------------------------------
** Please LIKE 👍, FOLLOW ✅, SHARE 🙌 and COMMENT ✍ if you enjoy this idea! Also share your ideas and charts in the comments section below! This is best way to keep it relevant, support us, keep the content here free and allow the idea to reach as many people as possible. **
-------------------------------------------------------------------------------
💸💸💸💸💸💸
👇 👇 👇 👇 👇 👇

FOREX EXOTICS : USD.SEK LONG BUY ? 13🌟TRADINGHi Traders,
Are USD.XXX pairs bullish ? This one, USD.SEK is pretty clean and gave two setups to get in a long buy. For now I think it's not finished, and probably a good time to take a trade.
Let's be careful tho, this up move we just had can as well be just the begining of a bigger corrective structure, as always there is at least 2 or 3 scenarios to consider.
Good luck !
13 Starz Trading.

4H: WKLY TYPE 1Apologies for the confusion. If you tend to use both pending orders and market orders on the 15-minute timeframe, it suggests that you use a combination of strategies depending on the market conditions.
Using pending orders allows you to set specific entry and exit levels in advance, which can be useful when you anticipate price movements or want to wait for certain conditions to be met before entering a trade. On the other hand, executing trades at the market price provides instant execution without waiting for price movements, which can be useful when you perceive an immediate trading opportunity.
By employing both approaches, you have the flexibility to adapt to different market situations and choose the most suitable method for each trade. It's important to select the appropriate trading strategy based on your goals, risk tolerance, and market analysis.

USD/SEKAnother pair with some good potential for a longterm currency swap play is the Swedish Krona. I am slowly starting to buy up some of the currency for a potential dip in the pairs pricing for a longer term play. I could always invest the cash on the Stockholm exchange into the sp500 when I am done buying the currency for an even longer term play

USDSEK has HTF Fibonacci Confluencegoing to start building long USDSEK positions with HTF fib confluences

USDSEK - LONG ONLY IF THE UPWARD BREAKOUT OCCURS ABOVE 10.5Analyzing the multitimeframe on USDSEK with Pitchfork, I suspected the price action is getting ready for the bullish. But before we take it for granted, wait for the upward breakout then it is highly likely to go up.

USD/SEK: Exploring Bullish Opportunities at High Time SupportIn the current market scenario, USD/SEK is approaching pivotal high time frame (HTF) support levels, suggesting a potential area where bullish momentum might find solid ground. With the focus on these support levels, it's worthwhile to shift attention to the low time frame (LTF) for potential bullish setups. What are your thoughts on this potential USD/SEK trade setup? Your insights contribute to a collaborative exchange of ideas within the trading community.
💡 Why Follow?
Gain insights into my Fibonacci approach.
Track the progress of the 100k funded account challenge.
Participate in discussions to enhance your trading knowledge.

USDSEK HTF Support Level EntryIn the current market scenario, USD/SEK is approaching pivotal high time frame (HTF) support levels, suggesting a potential area where bullish momentum might find solid ground. With the focus on these support levels, it's worthwhile to shift attention to the low time frame (LTF) for potential bullish setups. What are your thoughts on this potential USD/SEK trade setup? Your insights contribute to a collaborative exchange of ideas within the trading community.
💡 Why Follow?
Gain insights into my Fibonacci approach.
Track the progress of the 100k funded account challenge.
Participate in discussions to enhance your trading knowledge.

USDSEK LTF Speculation Playmight have jumped the gun on UJ and UCHF and was a little early to the bullish DXY party last night.. i got a decent entry on UJ just to get wicked out and then watch it hit targets.. anyway, here is a USDSEK LTF possibility
