SEKUSD trade ideas

USDSEK potential reversal!
USDSEK expected to rise up to 1st resistance at 9.55628 where it could potentially react off and drop down to 1st support at 9.40809.
Trading CFDs on margin carries high risk.
Losses can exceed the initial investment so please ensure you fully
understand the risks.


USDSEK approaching support, potential for a bounce!
USDSEK is expected to drop to 1st support at 9.40693 where it could potentially react off and up to 1st resistance at 9.49965.
Trading CFDs on margin carries high risk.
Losses can exceed the initial investment so please ensure you fully
understand the risks.


USD/SEK 9.49245 / 9.47372 VS 9.30490. Trade SetupsHello Traders, USD/SEK 9.49245 / 9.47372 VS 9.30490. looking for a small continuation/ consolidation / corrective pattern ( Yellow )
to continue the upside movement breaking 9.49245 / 9.47372 VS 9.53482 / 9.54526.
Or signs of reversal ( Impulse Correction / Blue ) back towards the previous Low's to retest 9.30490 for a bigger corrective pattern.

USDSEK potential reversal!
USDSEK expected to rise up to 1st resistance at 9.49965 where it could potentially react off and drop down to 1st support at 9.43431.
Trading CFDs on margin carries high risk.
Losses can exceed the initial investment so please ensure you fully
understand the risks.


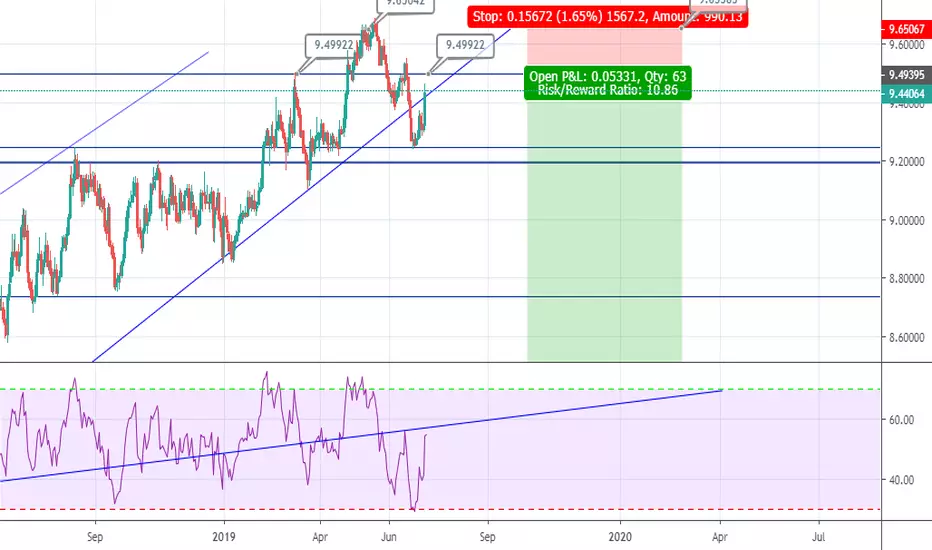
USDSEK Sell Hi All ,
This is one of our swing trade of 5 weeks , As you can see we have been stopped at profit above the previous support, as price has pulled back up to start forming a H&S . So now we set pending order at 9.49922 to sell for another 5 weeks . Or we wait and see what 9.49922 Resistance act as .
Either way will update . But this is one trade not to miss .
We are approaching selling zone !!.
Many Thanks.
USDSEK / 4H / ForecastI just entered a position in USDSEK for short. As both a Doji star, and a bearish engulfing have formed in the 2H inside this resistance area
Key Points:
Stop Loss : 9.42153
Entry : 9.38561
Take Profit : 9.26336

USD/SEK - Possible 1400 pip dropMonthly High
Ascending wedge formation
Price Retested and is making its continuation.
This could make a very nice long term trade set up. Nice reward to low risk.
Protect Your Profits along the way.
Trade at your own risk.
Join my team of traders and learn how to trade the forex markets. Includes free mentorship from me and a team of professional traders and educators (link in bio)

Swing Trade Idea on "USDSEK" by ThinkingAntsOkConsider this as a guide to develop your own setup.
Main Items we see on the Daily Chart:
a)Price has broken the descending trendline
b)Currently we can see an ABC formation (maybe an expanding Triangle)
c)This type of formations are considerer continuation structures
d)The price Broke out the corrective structure and now is making a pullback to the Trendline
Based on that we set on the Chart
-ENTRY
-STOP
-TP
Use them as an idea of where to set your orders if you were planning to take this trade, We have similar setups on EUR/USD + USD/JPY (the link is on Related Ideas)
Weekly Vision:

USD/SEK 9.35533 / 9.35084 VS 9.49245 / 9.47372.Hello Traders, USD/SEK 9.35533 / 9.35084 VS 9.49245 / 9.47372.
Correcting the Impulse ( Yellow ) possible Short Term Buy if we get a setup / flag ( Blue )
To retest 9.49245 / 9.47372.

USDSEK Buy SignalPattern: Channel Up on 1W.
Signal: Bullish as every time the price broke below the MA50, it always stayed supported above the previous low.
Target: 9.6500 (just below the 1D Resistance).


USDSEK Short BiasWelcome to everyone!
Today is the day of USDSEK.
usdsek just reacting the previous strong created supply area and going for short now.
as we know the strength of dollar is getting weaker now.
We always follow our rules and stick with our plan. But no method/plan help us without controling our emotions.
Without proper knowledge forex is just a gambling for the people who try to gain profit from it following by their luck.
So Short Bias right now. This is it. Enjoy
Happy Trading : )

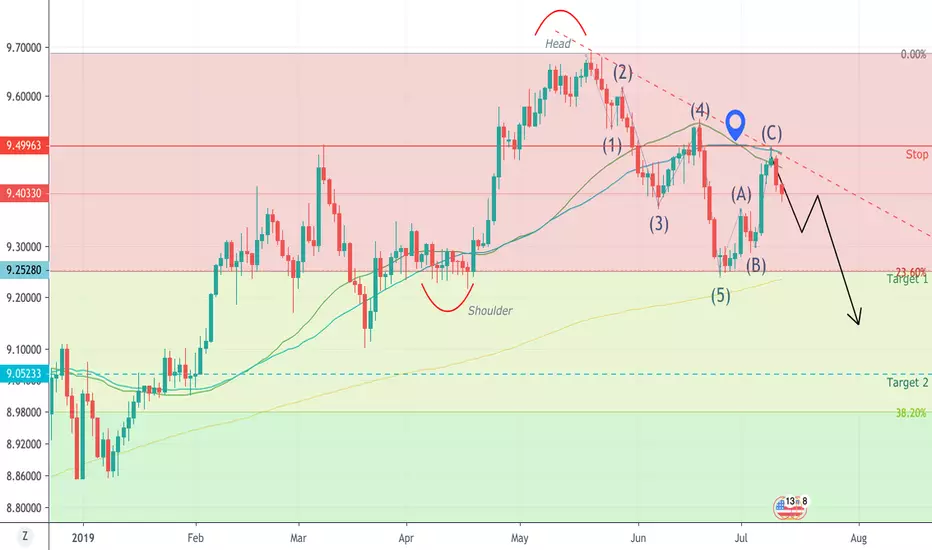
Right shoulder in USDSEK dailyLooking for wave 1 down after an ABC correction. First wave target is 9.27 where I expect a bounce followed by wave 3 down to 9. As long as bulls don't take out 9,5, I'm positive to this view. Also keeping an eye on MA40 and MA50 ratio.

38.2% & POSSIBLE 61.8% Retracement SHORT GWAVE38.2% & POSSIBLE 61.8% Retracement SHORT GWAVE.
FIB Retracement Percentage is calculated in a Higher Cartesian and or Euclidean Dimension.
PLEASE ALWAYS WAIT FOR STOCHASTIC CONFIRMATION!!! THANKS


USDSEK SWING TRADE SELL IDEAThis is an idea and not a signal to sell. It is for educational and demonstration purposes only. If you enter, you trade at your own risk. Always do your own analysis to confirm you agree with any idea before trading.
With that being said,
Price reached top of ascending channel and had bearish momentum. Looking for a pullback to the trendline and continuation of sell to a key zone in the market, which is the 50% or 61.8% fib level from swing low to swing high. The trade from the pullback to the trendline is a possible 575 pips after pullback.
Trade at your own risk.

