USD/SEK 1H Chart: Upper range line reachedThe US Dollar has been stranded in the 8.5675/8.9835 range since late April. Its southern boundary and the senior channel were tested mid-June. This move was followed by the Greenback initiating a new up-wave and reaching the 161.80% Fibonacci expansion line at 8.95 yesterday.
Given that the pair has reached the upper range boundary, it is likely that bears start to pressure the rate and thus push it lower. This assumption is likewise strengthened by the fact that the rate has breached the dashed short-term trend-line.
The base scenario favours the weakening of the strong upside momentum and a soon decline down to the 55-, 100– and 200-period (4H) SMAs or the other range line at 8.75 and 8.5675, respectively.
SEKUSD trade ideas

USDSEK WEDGE -- BREAKOUT PULLBACK SHORT Was waiting for this setup to form and it turned out perfect. Nice .618 retracement coupled with a beautiful shooting star, and also a wick touch against resistance.
Short Term Goal of 8.53066

USDSEK(4hr chart). Wolfe Wave(RSI bullish d, RSI(d) +d)USDSEK(4hr chart). Wolfe Wave(RSI bullish d, RSI(d) +d)

OPEN USDSEK daily tradeThe buy zone is between the the green and red lines. It's recommended to limit buy close to the green line, in order to guarantee the position. The red line is about 250 pips below the green line, and acts as the stop-loss level. There is no target price yet. This trade will be monitored once every evening. If there is no update, it means the trade is still active. Once the trade is closed successfully, a risk-to-reward ratio will be determined. This strategy only requires reviewing the price action trend once every day.

don't usually trade exotics but....we got a really nice harmonic pattern on the usd/sek, see a move back to the upside then a big drop

USDSEK SHORTUsually the SEKs, NOKs, TRYs, ZARs i.e. the USD, EUR and GBP pairs tend to head in the same direction.... having EURSEK long in the previous analysis and short on this one seems paradoxical and contradictory... am aware and wary of this as well, but each has merit on it's own. So I perceive a short setup on this one and will take advantage of the situation once the market passes muster and crosses thresholds.

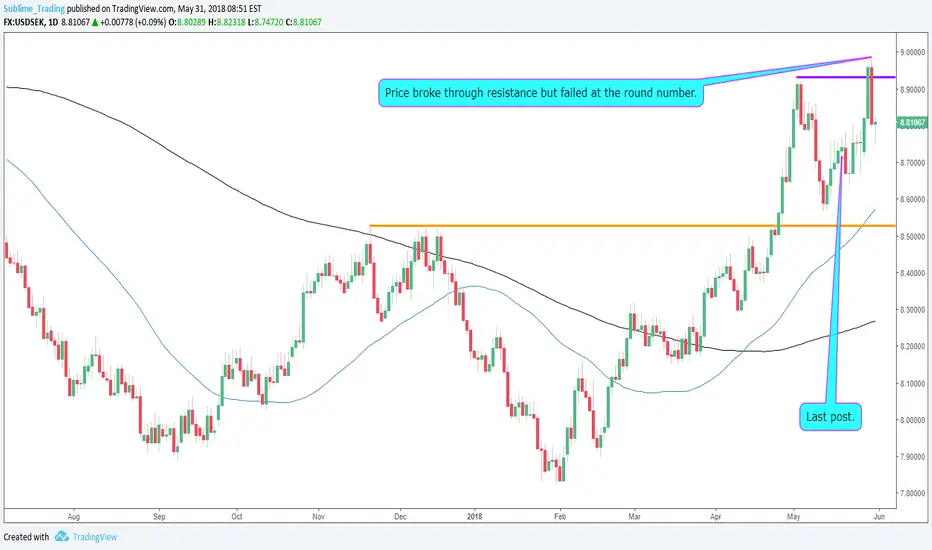
Round Number Holds Strong on The USDSEKLast post: May 20th. See chart .
Review: Price had found support and the bulls were back in control of the market.
Update: The bulls remained in control, taking price through resistance but this week has seen price fail at the round number 9.0000.
Conclusion: Standing aside for now until the round number is confirmed as support before considering long trades.
Any comments or questions, do not hesitate to leave them below. Give us the thumbs up if you share our sentiments!
Sublime Trading
38.2% Retracement SHORT GWAVE38.2% Retracement SHORT GWAVE.
FIB Retracement Percentage is calculated in a Higher Euclidean Dimension.
PLEASE ALWAYS WAIT FOR STOCHASTIC CONFIRMATION!!! THANK

USDSEK HIts new YTD HighsSEK weakness continues to reign , previously we saw a potential double bottom (DB) form with the February low (pattern later confirmed with a break of the neckline in April) and had further reason to be convinced of the reversal with an A-B-C reversal pattern forming off the same Feb low.
After reaching a YTD high of 8.9159 we saw a ner retest of the DB neckline but have now advanced to a YTD high of 8.96 and threatening a test of pysch level 9.00 as well as the pivot support from April 2017 at 9.10. IF we see price advance above these milestones then the next target is the 2016 high at 9.44.
Traders should look to get tactically long either on breakouts or pullbacks to prior pivots. Be wary of entering on overstretched bars, we may see a short term advance followed by a pullback to 9.00, an entry could then be taken from the next close at a new high
Good luck

USDSEK LONG Opportunity DIDO (Day In Day Out)Glancing at current market conditions, we can see that USD is creeping into overbought territory and could remain there if fundamentals are unchanged or positive.

USD/SEK 1H Chart: Bullish in short termUSD/SEK has been guided by two opposing channels. The most senior pattern was formed in December 2016, while the junior one has bounded the rate within the bounds of this aforementioned senior channel. The most recent up-wave started late in January when the Greenback reversed from the 7.80 mark.
The pair tested the upper boundary of the senior channel near 8.9025 during the first week of May. It has since edged lower but nevertheless remained near this long-term pattern.
Technical indicators flash bullish signals in the short term. It means that the rate is likely to re-test the senior channel at 8.9025 this week. This level is likewise strengthened by the weekly R2 and the monthly R1. The outlook in the medium term, however, remains bearish, showing that the senior channel is likely to be respected.

USDSEK ShortVery good reward potential for a short if the price manages to break first key area.
But first, I want to see a rejection off the area i marked, or I will enter on a breakout.
its all waiting game now. hopefully i never forget to check the chart.
Cheers!


After correction we should expect cotinuation of trend
We can see the support in red with an engulfing pattern showing the short downtrend have ended with the ichimoku cloud and stochastic confirming an uptrend in a long run.

USDSEK going to 11.4-12.3 ?!?!?! Hey folks!
And... No, this is not a joke.
Here´s my USDSEK chart which I did for fun, I hope you can learn or gain something from it.
This Monthly chart is giving me THREE reasons to believe theres a good probability USDSEK will reach stated TARGET, as long as we stay above current Black Support Line.
The Three Reasons:
1: Orange --- Overhead Resistance has been broken and support on it has been established. When this happened in the past, USDSEK made it´s way back to the top of the channel.
2: Purple --- Where is the 5th Wave?
Waves is only showing me 4 waves done, now, as for myself I´m used to something finishing with either 3 or 5 Waves and therfore The Bearish Three Drive looks promising.
3: Blue/Red --- Simple Support/Resistance Analyzes showing us how the price reacted at important locations and what it led to.
Feel free to express your thoughts..
I warmly welcome your comments and criticism, I hope I can learn something from you too!

USD-SEKAn eventual close of USD-SEK below the dotted line will give a bearish signal with the first target in the area 8.49.

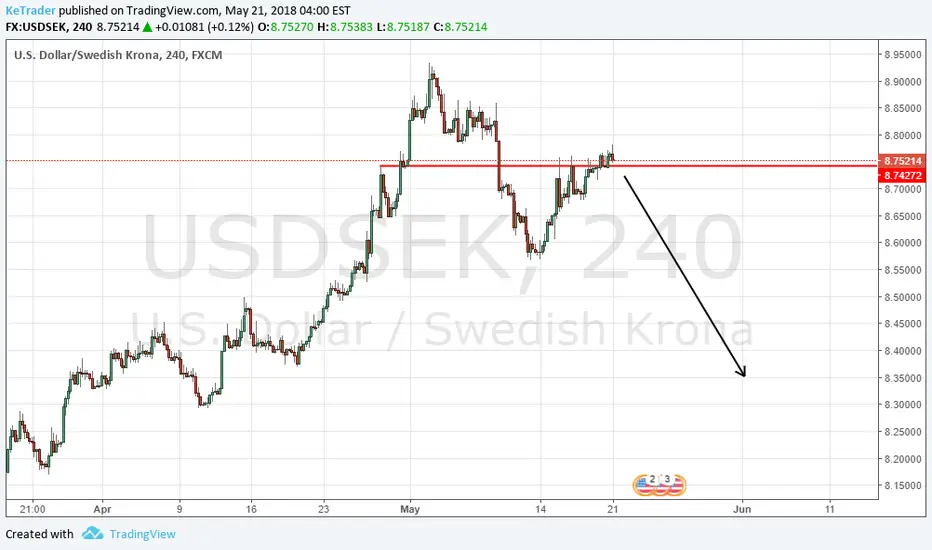
The Bulls Back in Control on The USDSEK?Last post: April 26th. See chart .
Review: A retest as support was expected following a break through key pivot resistance.
Update: The retest was sometime in coming. A break and close above May resistance is now needed to suggest a trend continuation.
Conclusion: Standing aside for now until the breakout and trend continuation has been confirmed.
Any comments or questions, do not hesitate to leave them below. Hit agree if you share our sentiments!
Sublime Trading


USD/SEK 1H Chart: Pair tests mid-2017 highStrong upside potential has been guiding USD/SEK since mid-April. The pair had breached a long-term channel down earlier in the month prior to gaining the necessary momentum to reach the 8.87 mark—the rate’s highest position since July, 2017. Along the way, the pair breached a three-month ascending channel near 8.75 that should point to further appreciation.
However, it is expected that bulls soon exhaust their upward momentum and allow bears to form a correction south. The prevailing channel suggest that the US Dollar could still edge slightly higher in this session towards the 8.90/95 area.
Subsequently, the pair should aim for the lower boundary of this pattern circa 8.75 in the short term and further down to the 50.0% Fibonacci retracement at 8.62 within the following two weeks.


USD/SEKOverbought and a retest of previous highs in the 8,50 area
stop loss 8,35
target 50% of trade 8,90
rest will follow to highs around 9,35-45
