USDSEK!This looks clearer than some dollar exotic pairs.
We see this market push up soon and looks ready!
Trade with care use a stop loss.
SEKUSD trade ideas

USDSEK shortAfter breaking the SL, I waited for the next zone to open a short position. I marked the zone, got a signal from the chart and opened short positions


usdsekusdsek as powel elected again usd gain power so i think it will compelete its move to next box so we wait till see what will happn in next resis

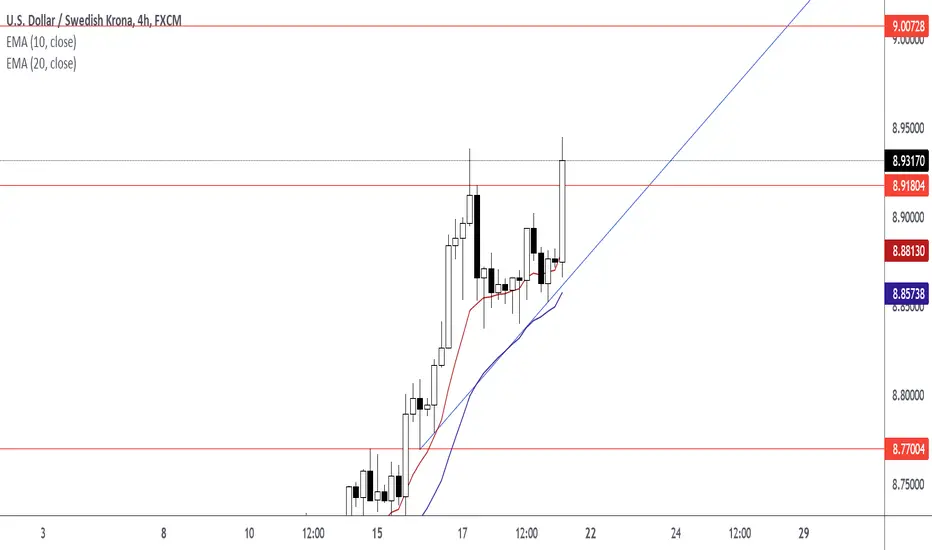
USDSEK Triangle Chart Pattern (Target Price 9.00728)USDSEK Foreign Currency Pair
Trend: Up
Level: EMA 10, EMA 20, Diagonal, Horizontal
Signal: Break Out Candle
USDSEK - BUY strategyThe Donchian channel is violated upside, and the bottom channel is shaping similar direction. Further, we have the DMI DI+ crossing above signal line showing we may see strong up move of USDSEK coming trading sessions.
Strategy BUY USDSEK 8.8700 with stop-loss below 8.5500. Profit objective 9.7500.

USDSEK shortThe higher-term market is upward. Now there will be a correction to this move and then up again. I marked a position, I opened a short

USDSEK shortThe market continues its downward movement. I have marked the place, price and target. I am waiting for the price to come back, the signal from the chart and I will open the position

USDSEK - BuyHello, traders
This pair has the potential to go higher after completing its 12345 pattern
If you have a similar trade, please comment below
Good luck :)

Low probability high reward LONGThe dollar has been drowning. Might be time for it to catch it's breath.

Bullish trend expectedThis chart currently in distribution phase ,after analyze its candle, it may be go bullish trend.

USDSEK 4hrs order blockWe can clearly how price manipulation traders at the former resistance level, it behaved liked it was going down and later went up. The candles that confused traders by going down put together is my order block, expecting price to reject and reverse when it gets there, anticipating a sniper entry

LONG [U.S. DOLLAR / SWEDISH KRONA]Series of higher highs and higher lows is visible, which indicates it is in bullish trend.

analyse sur usdsek l observation de la paire de devise usdsek nous laisse voir le rejet du prix par la moyenne mobile 100 sur une periode de 5mn et une resistance testee a 3 reprises sur la periode h4 au vu de cela nous supposons fortement le chute du dollar americain par rapport a la couronne suedoise

possible harmonicpossible harmonic pattern forming with a combination of equal measured move if it completes


the wave catcher Aroon indicator
input – default 14
Colour – Aroon up – green – Aroon down red
So when the aroon up intersects with the aroon down from below this is a signal to buy
So when the around down intersects with the aroon up this is a signal to sell
Bollinger bands default 20 – works like an elastic band
Remember in a up trend the middle band becomes the new line
Fractals-
Input – 2
Style: shapes – green - triangle – below bar
Shapes- red – inverted triangle – above bar
Fisher – example
Up tend
Hits dark green climbs to light green it’s a 5 min buy
climbs to yellow line 3 min buy
Down trend
Touches red, falls to orange it’s a 5 min sell
falls to yellow line 3 min sell

USDSEK Sell strong breakdown Hi Guys, USDSEK is completing a corrective structure and it seems like it will make an impulse to the downside. Watch to sell the break out.
Trade with care !

nice set up this weeki may grab this bag they are giving away on this pair well see if the low is protected


USD/SEK LongUSD/SEK seems to have formed a double bottom pattern and is now moving higher towards well defined resistance zones. Shorter term it has formed a small double top which could see prices move down to support and clear out some stops before climbing higher. It may simply push higher and breakout from here though as well.
OANDA:USDSEK

USDSEK 4hrsAfter the drop last week, am expecting price to correct to my entry and then continue to go short
