You Are NOT Your P<here was once a tree that stood alone at the edge of a cliff, overlooking the vast sea.
Some days, the sun shone bright, the winds gentle, the water below calm and peaceful. Other days brought heavy storms, fierce winds, crashing waves, rain so relentless it seemed the skies might never clear again
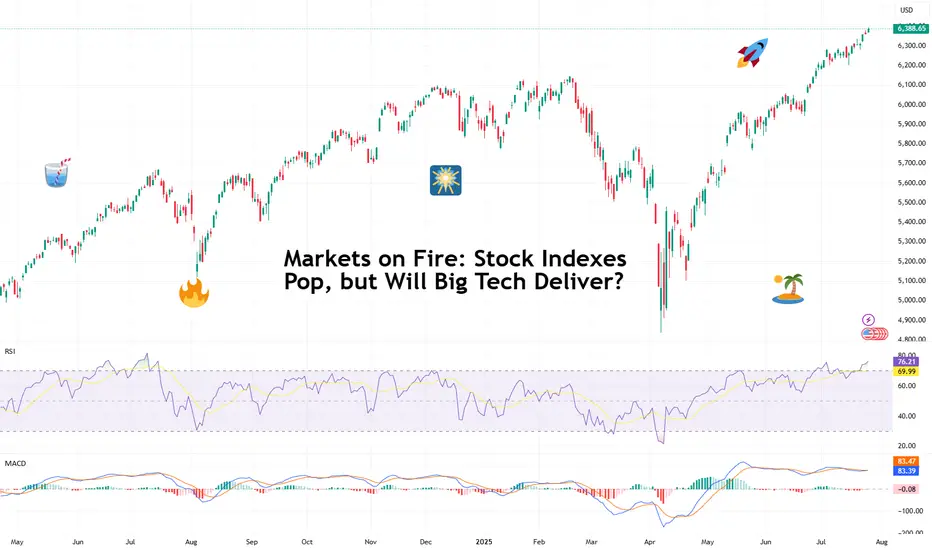
Markets on Fire: Stock Indexes Pop, but Will Big Tech Deliver?S&P 500 and Nasdaq set records. Now it's up to big tech to justify that.
Talk about forward-looking valuation. Tech companies’ valuations are largely based on future potential rather than current performance. And that’s what we’re seeing right now getting priced in across the big indexes.
You’d
Hellena | SPX500 (4H): LONG to resistance area of 6596 .Dear colleagues, I haven't made a forecast for the SNP500 in a long time and was waiting for a correction, but it seems that a major correction is not yet close, and at the moment the price continues to be in an upward five-wave movement.
Therefore, I believe that we should expect to reach the 6596

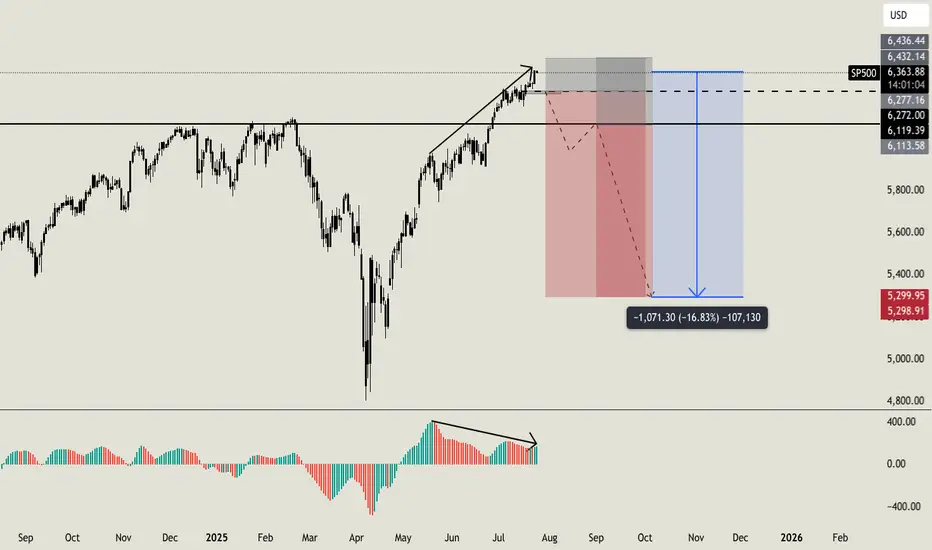
Do you want to keep buying SP500?Hello all. I usually love to work analyzing volumes, times and key level, i am not used to check the standard indicators, but this time i'll made an exception. Lot of indicators (AO, MACD, RSI, OBV) are showing weakness on higher timeframe with a strong bearish divergence (like the one i am sharing
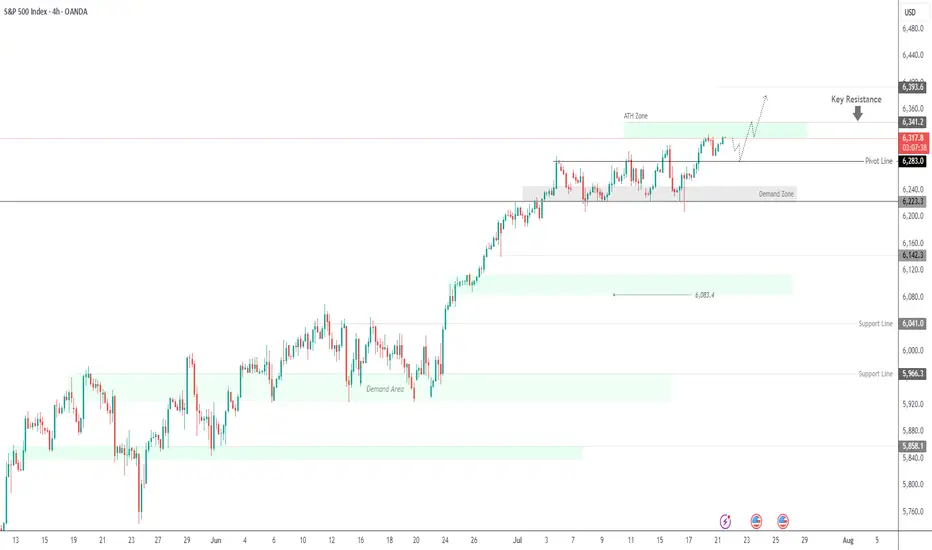
SPX500 Near ATH | Earnings Week Could Fuel Next MoveSPX500 | Weekly Outlook
The S&P 500 continues its bullish run, trading at record highs as investors await a critical week of tech earnings. Reports from Alphabet and Tesla could be key in justifying the lofty valuations driven by the AI boom.
Technical Outlook:
The price is expected to consolidate
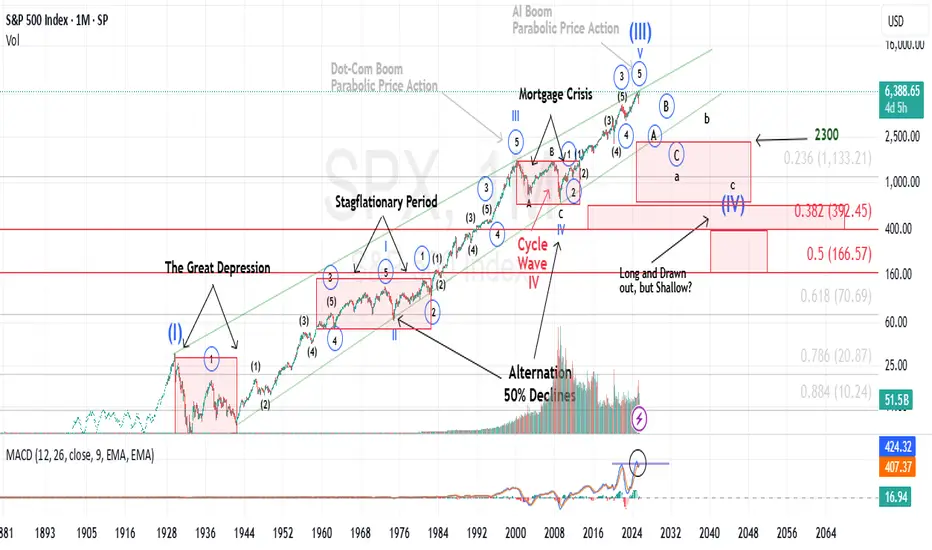
History does not repeat itself, however it tends to rhymeIt’s widely accepted that Mark Twain once said (or wrote) that “history does not repeat itself, however it tends to rhyme”.
Historical Parallels to a Super Cycle Wave (I) Top in U.S. Equities
The road to a major market top is often paved with echoing patterns from the past, and today's landscape b
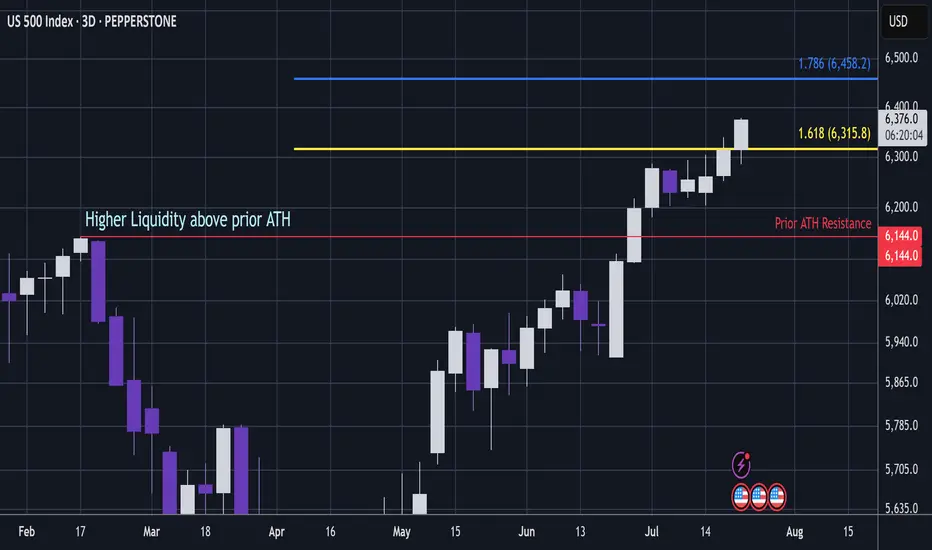
US500 - Can S&P Pass Critical Ratio / Liquidity ZoneS&P (Pepperstone CFD)
Price has popped above the 1.618 extension, which is a key ratio zone.
A bearish whipsaw in this area could be dangerous.
However, if price continues to push through this level, it signals that S&P is entering a very bullish phase.
The area above prior ATH resistance hold
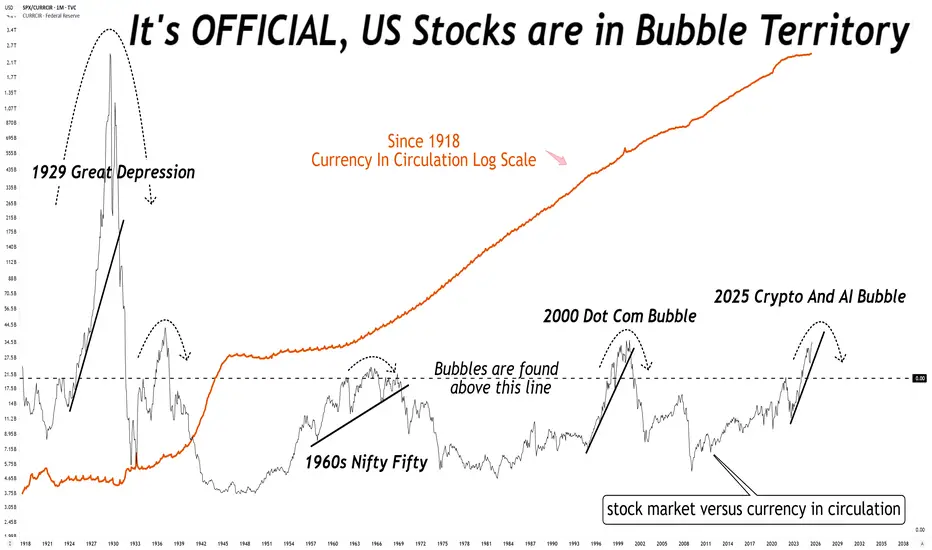
What do you mean the stock market is not in a bubble?What do you mean the stock market is not in a bubble?
No, it is not different this time, there is always a reversion to mean.
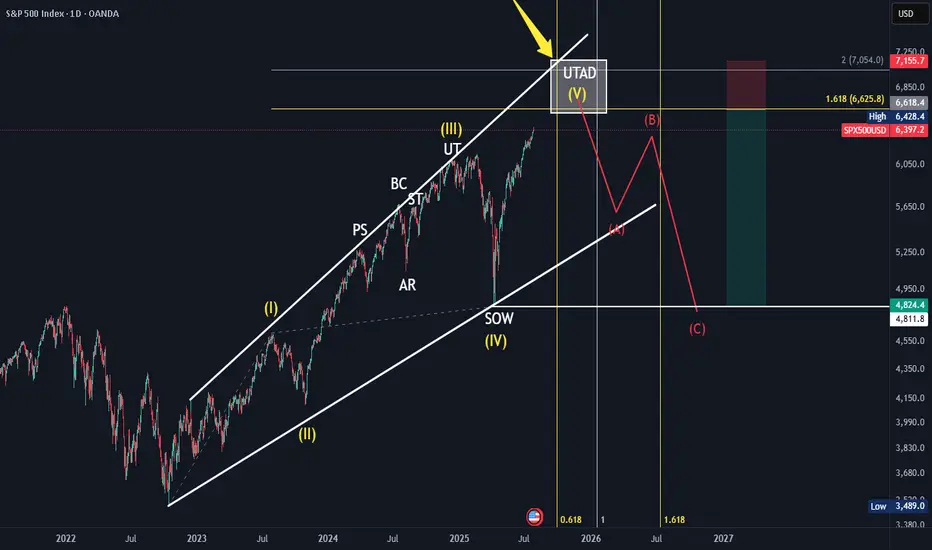
SPX Elliot Wave Count, Wykoff DistributionBased off the HTF elliot wave count aligning and in confluence with a HTF Wykoff distribution. With the top coming in between 6600-7000ish around September 2025 till January 2026. Further confluence with trendline, fibonnacci time and fibonnaci trend and extension.
S&P500 INDEX (US500): Classic Gap Opening TradeI noticed a classic gap up opening on 📉US500 Index and believe it will be filled today.
The formation of an intraday bearish change of character (CHoCH) on the hourly chart indicates a strong likelihood of continued bearish movement.
Target - 6400.

See all ideas
Displays a symbol's price movements over previous years to identify recurring trends.
Frequently Asked Questions
S&P Index Cash CFD (USD) reached its highest quote on Jul 25, 2025 — 6,397.91 USD. See more data on the S&P Index Cash CFD (USD) chart.
The lowest ever quote of S&P Index Cash CFD (USD) is 2,177.62 USD. It was reached on Mar 23, 2020. See more data on the S&P Index Cash CFD (USD) chart.
S&P Index Cash CFD (USD) is just a number that lets you track performance of the instruments comprising the index, so you can't invest in it directly. But you can buy S&P Index Cash CFD (USD) futures or funds or invest in its components.