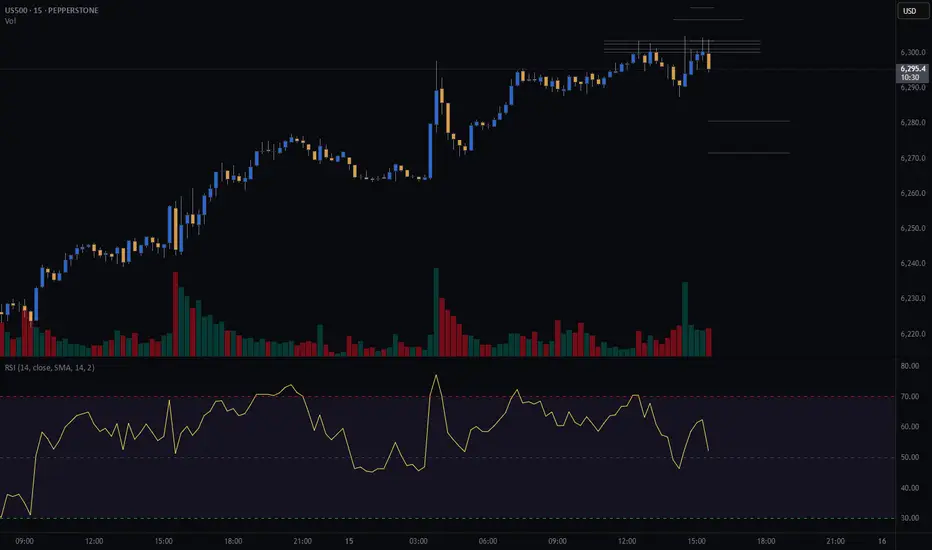
SPX500 Formed false breakout Bearish Bias 6,205 SP500 Short-Term Bearish Bias
The SPX500 remains under pressure as it trades below the key resistance level of 6260. Price action suggests a potential rejection from this resistance, signalling a continuation of downside momentum.
This bearish sentiment is further fuelled by recent tariff escalati

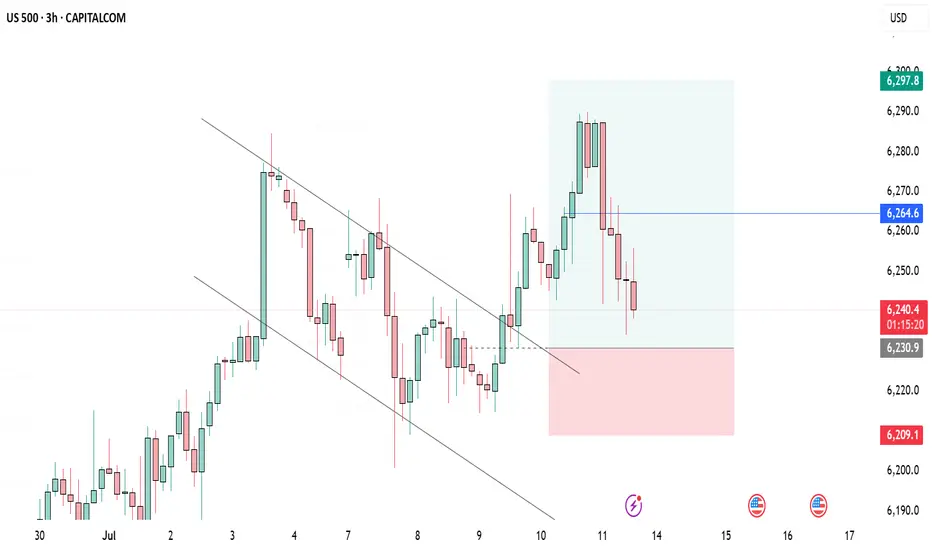
S&P500 (CASh500) Short - double top 15minEntry = 6303.4
SL = 6312.8
Take profit level 1 = 6280.7
Take profit level 2 = 6271.6
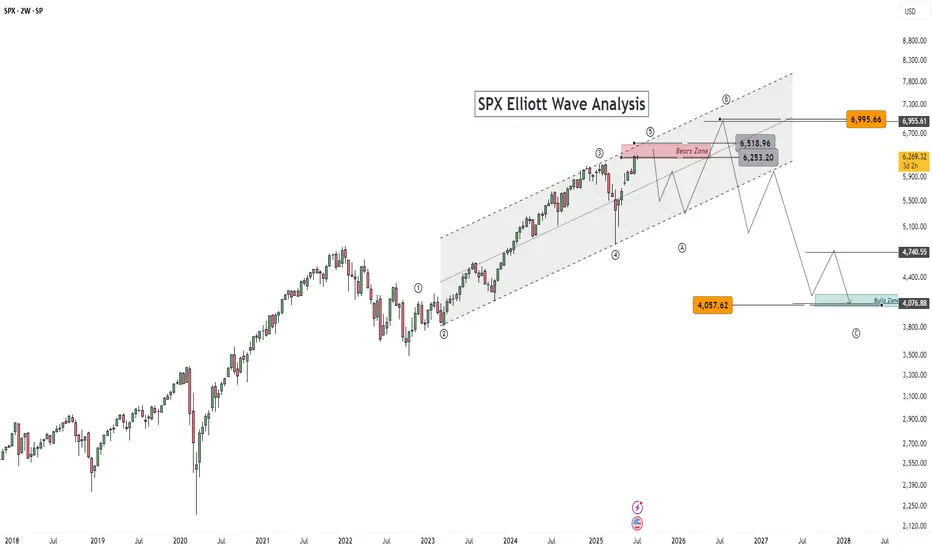
S&P 500 and the Elliott Wave TheoryThis is a continuation of a Weekly chart that I had previously posted. Our Wave 2(Red) was a Zigzag and the expectation is a Flat for Wave 4(Red) which we see occurred. Since Wave 4(Red) completed, a Wave 5(Red) was triggered. We can expect our Wave 5 to express itself in 5 Waves just like any other

S&P 500 weekly timeframeS&P 500 in g of G of diametric aiming for ~8000 in 2026-27 and ~11000-13000 for 2029-2030
So every correction would be temporary until then

Why Traders Freeze: The Psychology Behind Not Cutting LossesFirst up: let’s address the elephant in the room. Loss aversion — that great human flaw. From the moment your ancient ancestor decided to poke a saber-toothed tiger to see what happens, the brain has been hard-coded to avoid pain at all costs.
Loss aversion is literally in your DNA — studies show

S&P500 Accumulation almost over. New rally begins.The S&P500 index (SPX) has been trading within a 3-month Channel Up pattern, within which, it's been replicating almost the same structure. This involves an aggressive Bullish Leg Phase (dotted Channel Up), followed by a correction/ Accumulation Phase (blue Channels), which eventually leads to the n

This is just my Elliott Wave Analysis not financial Advice. $SPThis is just my Elliott Wave Analysis not financial Advice. SP:SPX #SPX SP:SPX
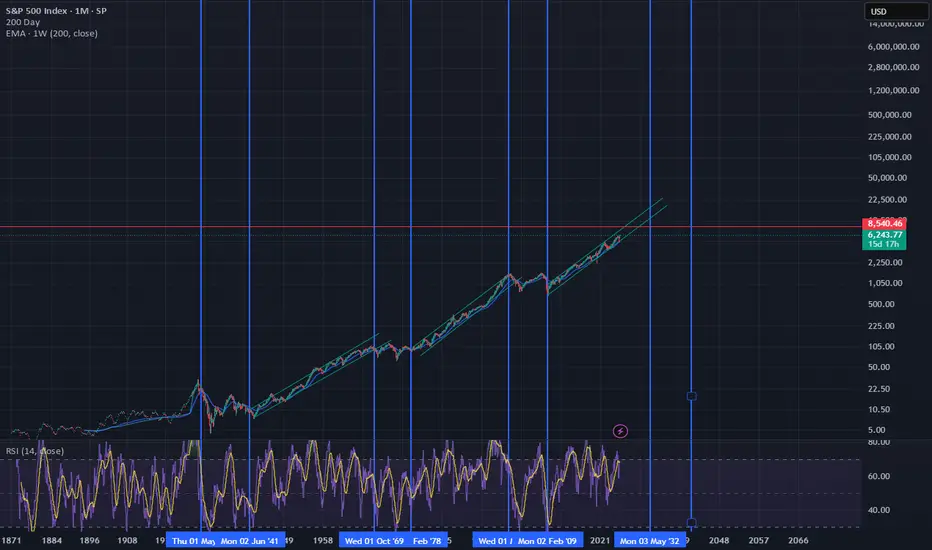
IS THE STOCK MARKET HEADING INTO DOT COM BUBBLE 2.0?In this video we look at the 3 month chart of SP:SPX using the traders dynamic index & Fibonacci retracement levels to put together a bullish case for the overall stock market to go on a monster rally over the next 7 years
We also theorize about how over the next 2 years the SP:SPX can indeed h

A steady move up for the next 3 yearsYou can clearly see the pattern. The boom/bust cycle, and inflation. Don't expect my lines to be exact. Imagine bitcoin if we hit the upper trend line.
Bullish for the next 3-5 years and another crisis. (2030)
They should teach this in school.
See all ideas
Displays a symbol's price movements over previous years to identify recurring trends.
Frequently Asked Questions
US 500 (SPI) / US Dollar reached its highest quote on Jul 10, 2025 — 6,335.63 USD. See more data on the US 500 (SPI) / US Dollar chart.
The lowest ever quote of US 500 (SPI) / US Dollar is 2,172.13 USD. It was reached on Mar 23, 2020. See more data on the US 500 (SPI) / US Dollar chart.
US 500 (SPI) / US Dollar is just a number that lets you track performance of the instruments comprising the index, so you can't invest in it directly. But you can buy US 500 (SPI) / US Dollar futures or funds or invest in its components.