SPX500 Near ATH | Earnings Week Could Fuel Next MoveSPX500 | Weekly Outlook
The S&P 500 continues its bullish run, trading at record highs as investors await a critical week of tech earnings. Reports from Alphabet and Tesla could be key in justifying the lofty valuations driven by the AI boom.
Technical Outlook:
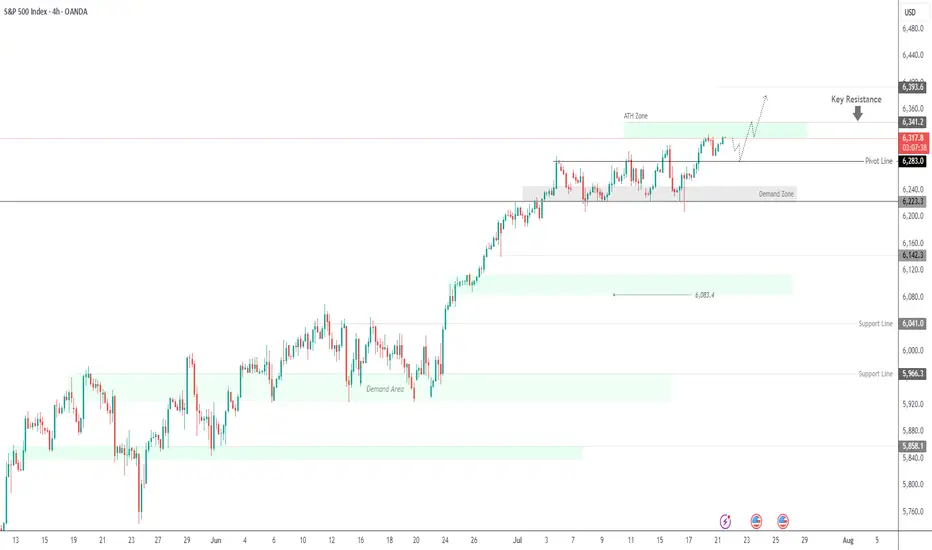
The price is expected to consolidate between 6341 and 6283 before any decisive move. A short-term bearish correction may occur initially, but if the price holds above the support zone, a push toward a new ATH at 6341 is likely. A breakout above this level could extend gains toward 6375 and 6393.
However, a break below 6283 would indicate weakness, potentially driving the price toward the demand zone near 6250 and 6224.
Support: 6283 · 6250 · 6224
Resistance: 6341 · 6375 · 6393
SPIUSD trade ideas
S&P 500 and the Elliott Wave TheoryThis is a continuation of a Weekly chart that I had previously posted. Our Wave 2(Red) was a Zigzag and the expectation is a Flat for Wave 4(Red) which we see occurred. Since Wave 4(Red) completed, a Wave 5(Red) was triggered. We can expect our Wave 5 to express itself in 5 Waves just like any other Wave. We can observe that our Wave 2(Green) was a Flat and we can expect our Wave 4(Green) to be a Zigzag. Wave 3(Green) was a strong upward move and a confirmation at its current price would trigger a Zigzag correction. This would be our Wave 4(Green) and would set the stage for the last wave before a major correction.

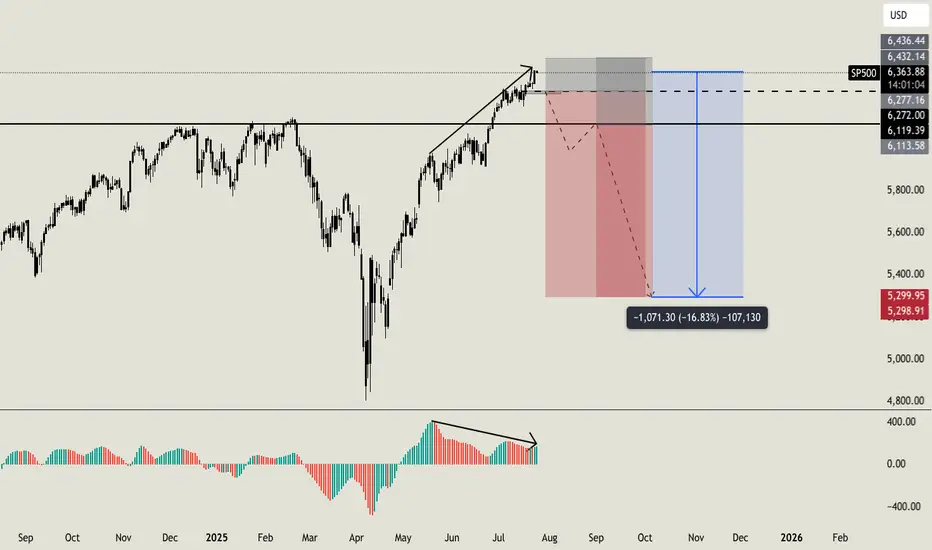
Do you want to keep buying SP500?Hello all. I usually love to work analyzing volumes, times and key level, i am not used to check the standard indicators, but this time i'll made an exception. Lot of indicators (AO, MACD, RSI, OBV) are showing weakness on higher timeframe with a strong bearish divergence (like the one i am sharing now on AO). On smaller timeframe i usually ignore this signals, because they can result in a little retrace, but on higher timeframe like this one can be a strong reversal indicator. But this is not the only things that let me open this position. Going deeper into my analysis, i have a first key level at $6270. Once we will break below this level, i'll open my first sell order with a stoploss a little higher than ATH. If price will break below my second key level at $6120 i'll open my second short order. My main and final target is $5300 (around -16% from now) but i will consider to secure profits before this level. I'll update you guys, and let me know if you are agree with me or not. Cheers
S&P 500 weekly timeframeS&P 500 in g of G of diametric aiming for ~8000 in 2026-27 and ~11000-13000 for 2029-2030
So every correction would be temporary until then

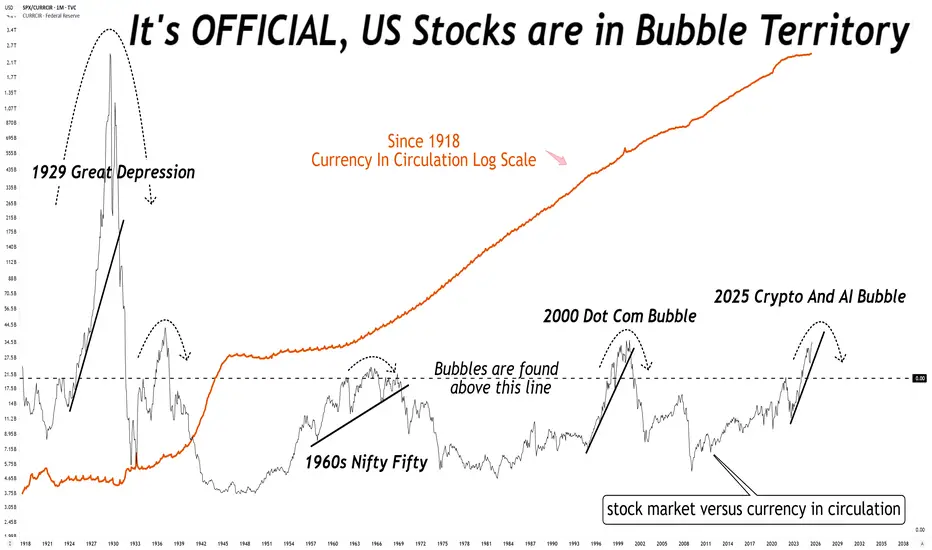
What do you mean the stock market is not in a bubble?What do you mean the stock market is not in a bubble?
No, it is not different this time, there is always a reversion to mean.
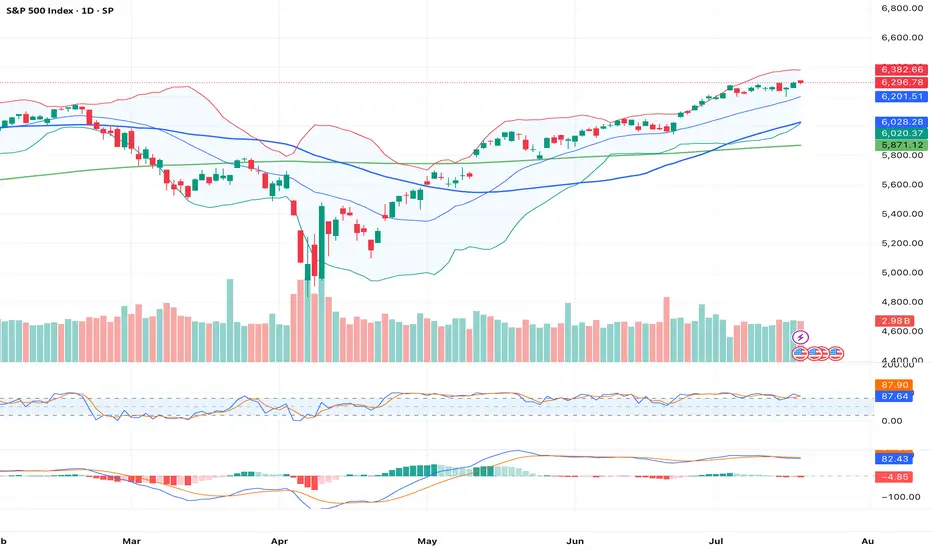
1_Day_ChartThis chart represents the 1-day (Daily timeframe) price action of the S&P 500 Index (SPX), offering a focused view of market sentiment, key levels, and trend momentum as of . Each candlestick reflects a full trading day.
📊 Chart Parameters:
Instrument: S&P 500 Index (SPX)
Timeframe: 1D (1-Day)
Exchange: NYSE / NASDAQ Composite (tracked as index)
Date Range Displayed: Past 3–6 months (approx.)
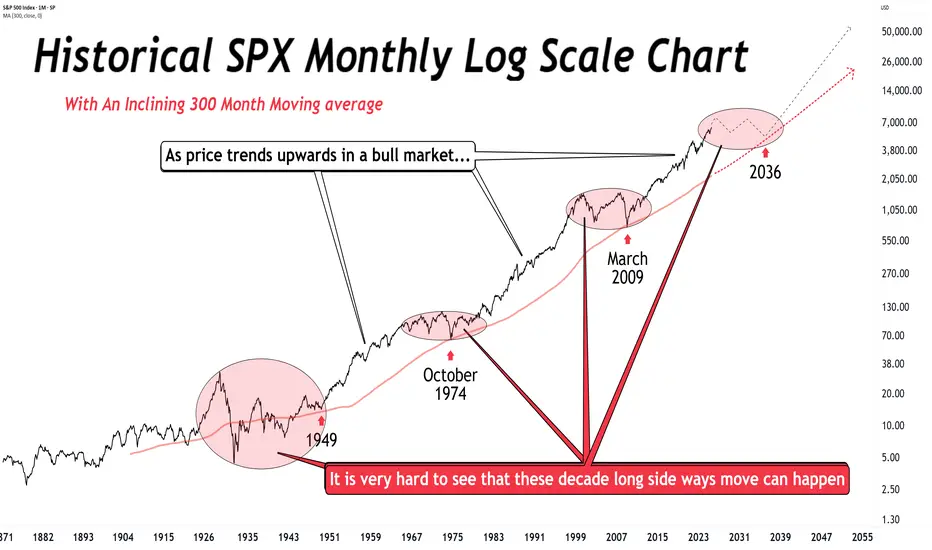
S&P500 This is why every CORRECTION is a GIFT.The S&P500 index (SPX) has been steadily rising since the April bottom to new All Time Highs (ATH). On the grand 100 year scale, the February - March tariff fueled correction, has been nothing significant. The last true technical correction has been the 2022 Inflation Crisis because it touched, and instantly rebounded on, the 1M MA50 (blue trend-line).
This is not the first time we bring forward our multi-decade perspective on stock and in particular this chart. But it serves well, keeping us into the meaningful long-term outlook of the market. This suggests that since the Great Depression and the first signs of recovery after the 1935 - 1941 Bear Cycle, the market has entered a multi-decade Channel Up, which is divided into long-term aggressive expansion periods (Bull Cycles) and shorter term depressions (Bear Cycles).
During a Bull Cycle, every test of the 1M MA50 is a instant cyclical buy opportunity and in fact that isn't presented very often. During a Bear Cycle, the market makes an initial aggressive correction below the 1M MA50, turns increasingly volatile for 5-7 years, trading sideways within the Channel Up with its second peak resulting into a 2nd correction that eventually breaks below the 1M MA200 (orange trend-line).
That is what we call a 'generational buy opportunity' as in the past 80 years, it has only been taken place 2 times.
Right now (again this is not something we mention for the first time), the market is at the start of the A.I. Bubble, with incredibly strong similarities with the Internet Bubble of the 1990s.
In fact, relative to the Internet Bubble, it appears that we are on a stage similar to 1993 - 1994, before the market turned parabolic to the eventual Dotcom Bust of 2000.
As a result, from a technical perspective, every 'small' correction such as the one we had this year, is a blessing in disguise (buy opportunity). As the index grew by 5 times during the Internet Bubble (300 to 1500), it is also very possible to see it approach this feat going from roughly 3500 (late 2022) to 14000 (by late 2032) and touch the top of the multi-decade Channel Up.
Are you willing to miss out on this generational wealth creation opportunity?
-------------------------------------------------------------------------------
** Please LIKE 👍, FOLLOW ✅, SHARE 🙌 and COMMENT ✍ if you enjoy this idea! Also share your ideas and charts in the comments section below! This is best way to keep it relevant, support us, keep the content here free and allow the idea to reach as many people as possible. **
-------------------------------------------------------------------------------
💸💸💸💸💸💸
👇 👇 👇 👇 👇 👇

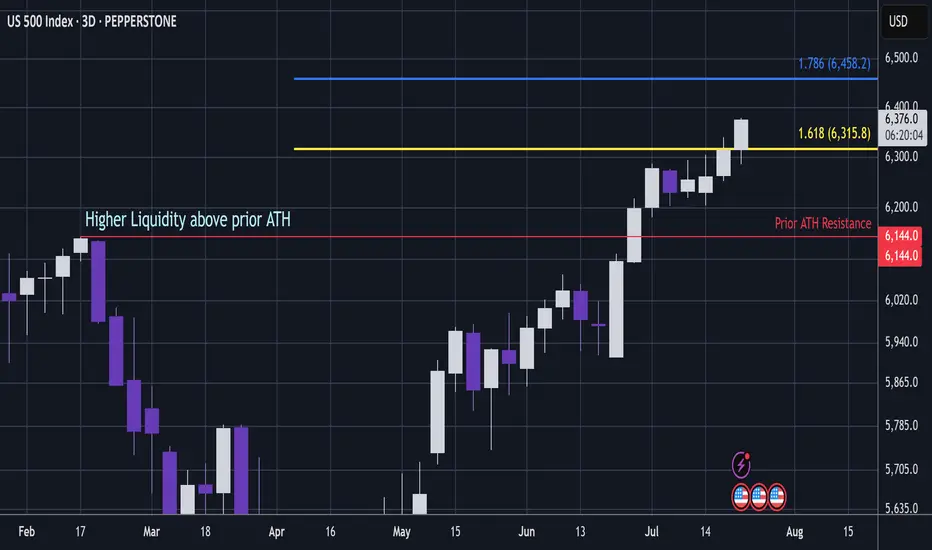
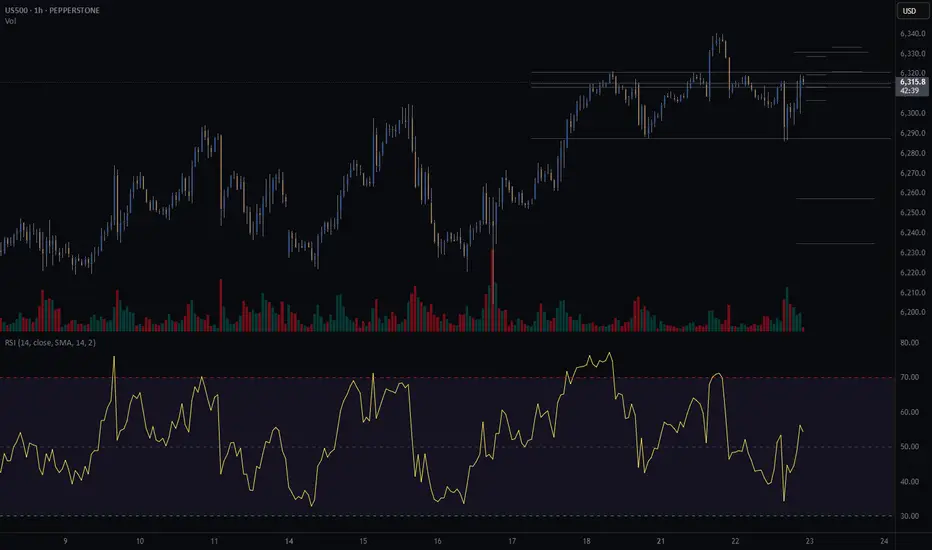
US500 - Can S&P Pass Critical Ratio / Liquidity ZoneS&P (Pepperstone CFD)
Price has popped above the 1.618 extension, which is a key ratio zone.
A bearish whipsaw in this area could be dangerous.
However, if price continues to push through this level, it signals that S&P is entering a very bullish phase.
The area above prior ATH resistance holds high liquidity.
If price moves beyond this ratio band, it will signal that a reversal in this zone is unlikely.
That said, if it’s still in this band when Trump tariffs are reinstated potentially on 1 August, then this is looking dangerous 🧐.
(Fib trendlines lower in the chart).
This analysis is shared for educational purposes only and does not constitute financial advice. Please conduct your own research before making any trading decisions.
Rob the Rally SPX500: Enter Before Resistance Catches You🦹♂️💰**“SPX500 Street Heist” – Thief-Style Robbery Plan for Bulls!**📈💸
(Powered by Thief Trader's Market Robbing Tactics – Scalp | Swing | Day Trade Edition)
🌍Hello, Global Money Hunters!
📣 Salaam, Bonjour, Ola, Hola, Hallo, Marhaba & Welcome to the heist floor! 🎩💼
Thief Trader is back again with a loaded plan to rob the market clean — this time targeting the mighty SPX500 / US500 🎯. Based on a fusion of technical setups, macro sentiment, and the Thief Trading System, we’ve set our sights on the next breakout vault of Wall Street.
🎯 The Gameplan – Heist the Resistance Vault
The index is entering a high-risk resistance barricade — overbought, consolidated, and heavily guarded by bearish robbers (sellers). This is the zone where the market police lurk and trend reversals often get triggered. However, smart thieves always plan with precision.
Here’s the mission briefing:
🔓Entry Zone (Break-in Point)
💥 “The vault is open — grab the bullish loot!”
Enter Long anywhere close to market price or on pullbacks near recent swing lows/highs.
Preferred timeframes: 15-min to 30-min for sniper-level accuracy.
Deploy DCA-style limit orders (layered entries for maximum control).
🛑Stop Loss (Escape Hatch)
Base SL on recent swing low candle wicks on the 4H timeframe.
Suggested: ~6250.00 — but adapt based on your risk appetite, lot size, and position stacking.
📈Target / Loot Location
🎯 Primary Take-Profit: 6450.00
Or… pull out early if you spot resistance fighters guarding the vault.
Use trailing SL to secure gains and manage getaway.
⚡Scalper’s Notice
Only Long-side allowed!
Got big capital? Jump in now.
Running low? Tag along with swing traders and follow the robbery protocol.
Always protect your bag with dynamic trailing stops.
🧠Fundamental Fuel Behind the Plan
Bullish sentiment across major indices
Macro trends, COT positioning, sentiment outlook, and intermarket analysis all greenlit
Geopolitical and Fed tone supportive — tap into real data before entering
👉 Always analyze: News, Fundamentals, Sentiment, COT reports, and macro conditions.
🚨NEWS ZONE ALERT – No Loud Moves!
Avoid entry during major economic news drops
Use trailing SLs to guard profits
Don’t let your open trades get caught in the chaos of news releases!
💥Let’s Boost the Thief Army!
Smash the BOOST button 💖 to power up the robbery crew.
Support the strategy, share the love, and stay ahead of the game using Thief Trading Style. Every trade is a step closer to freedom from financial traps. 🚀💰🎉
📌Disclaimer: This is a general market analysis for educational purposes and should not be considered personal financial advice. Please evaluate your own risk management strategy before placing trades.
📌Markets shift fast — stay flexible, stay alert, and always rob smart.
🔥Stay locked in for the next heist plan — Thief Trader signing off for now…
💸💼📈 Trade smart. Rob harder. 🤑🦹♂️📊

People don't like the truth! Let's be honest, people don't like honesty. They prefer ideas that affirm their own beliefs.
When I read articles and posts from newer traders, it's often from a place of "all in" diamond hands and the notion that things go up forever.
I've been a trader for over 25 years now, and the game isn't about making a quick buck, it's about making money over and over again. This got me thinking, the issue is when you deal with a small account you require leverage, small timeframes and of course the "shit" or bust mindset. If you lose a thousand dollars, $10,000 even $100,000 - what does it matter? That's no different than a game of poker in Vegas.
The idea of being 80% in drawdown, is alien to me. The idea of one trade and one win is also a crazy notion.
Instead of playing with the future, there is an easier way to work. This isn't about slow and boring, it's about psychology and discipline. 10% returns on a million-dollar account isn't all that difficult. Instead of aiming for 300x returns on an alt coin (due to the account size being tiny) You can make less of a percentage gain with a larger account size.
In terms of psychology - the word " HOPE " is used, way too often, it's used when you hope a stock or the price of Bitcoin goes up, it's used when you hope the position comes back in your favour, it's used when you want your 10,000 bucks to double.
This isn't trading, it's gambling.
The truth is, it's not the winners that make you a good trader. It's the way you deal with the losses.
Once you learn proper risk management, a downtrend in a market move is a 1-2% loss coupled with a new opportunity to reverse the bias.
As a disciplined trader, the game is played differently.
Let's assume you don't have $100k spare - prop firms are a great option, OPM = other people's money.
Remove the risk and increase the leverage, all whilst trading with discipline.
The market goes through many phases, cycles and crashes.
You don't always need something as catastrophic to take place, but if you are all in on a position. You need to understand that losses can be severe and long-lasting.
When everyone sees an oasis in the desert, it's often a mirage.
You only have to look at the Japanese lesson in 1989, when the Nikkei was unstoppable-until it wasn't. For that short space in time, everyone was a day trader, housewives to taxi drivers.
Everyone's a genius in a Bull market.
Then comes the crash. The recovery time on that crash?
34-years!!!
I have covered several aspects of psychology here on TradingView;
When it comes to trading, if you are able to keep playing. It's a worthwhile game. If you are gambling, it's a game whereby the house often wins.
Right now, stocks are worth more than their earnings. Gold is up near all-time highs, crypto, indices the same.
All I am saying is if you are all in. Be careful!
Disclaimer
This idea does not constitute as financial advice. It is for educational purposes only, our principal trader has over 25 years' experience in stocks, ETF's, and Forex. Hence each trade setup might have different hold times, entry or exit conditions, and will vary from the post/idea shared here. You can use the information from this post to make your own trading plan for the instrument discussed. Trading carries a risk; a high percentage of retail traders lose money. Please keep this in mind when entering any trade. Stay safe.
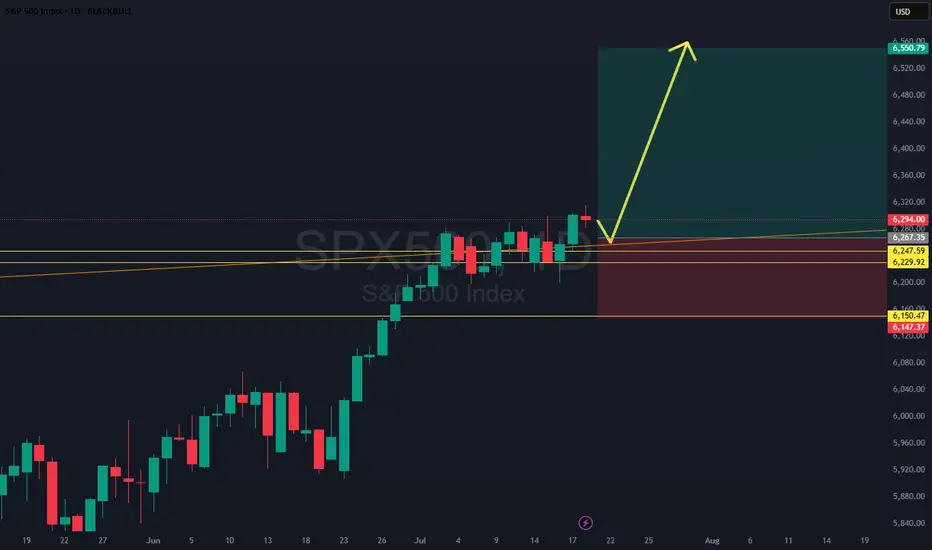
S&P500 Critical short-term crossroads.The S&P500 index (SPX) has been trading within a Channel Up since for the entirety of July and right now is ahead of important crossroads. It either breaks out above the pattern or pulls back to price a new Higher Low.
Based on the 4H CCI and the similarities with the June 24 - 25 consolidation, there are higher probabilities to break upwards. That fractal reached the 2.0 Fibonacci extension after it broke out. We will wait for confirmation and if it's delivered, we will buy the break-out and target 6460 (just below Fib 2.0 ext).
Until then, being so close to the Channel Up top, makes a solid short opportunity targeting a Higher Low (bottom). The previous one was priced exactly on the 4H MA100 (green trend-line) so that's our target or 6250 if it comes earlier.
-------------------------------------------------------------------------------
** Please LIKE 👍, FOLLOW ✅, SHARE 🙌 and COMMENT ✍ if you enjoy this idea! Also share your ideas and charts in the comments section below! This is best way to keep it relevant, support us, keep the content here free and allow the idea to reach as many people as possible. **
-------------------------------------------------------------------------------
Disclosure: I am part of Trade Nation's Influencer program and receive a monthly fee for using their TradingView charts in my analysis.
💸💸💸💸💸💸
👇 👇 👇 👇 👇 👇

SPX500: Clean Breakout Setup - Trade of the Week?SPX500 just broke and closed above a key daily level, confirming strength after a bull flag formed off a skinny leg up. The plan? Wait for a retest of that flag structure, then ride momentum higher. We’ve got a conservative stop below solid support, making this one of the cleanest, most technically sound setups of the week. Only watch-out: price may not give the retest and could continue running. Either way, structure favors the bulls.
3 month rally just not sustainable SPXThe economy is not doing horribly, but many are citing lagging indicators and there's signs of that this level is just not sustainable. Current levels abouve 9, 50, 200 SMAs! Seriously, what's great that isn't artificially propped up. Highest bankruptcies, highest level of housing unaffordability, dollar losing over 10% of value YTY, unemployment #s but that's bc people are giving up and it's a lagging indicator, hardship withdrawals up, defaults across the board up at over 10 year levels, banks with historic unrealized losses on their books (how much did Wells Fargo drop the other day!), yields going up up up. The Champage effect will end and many will get wiped out, unfortunately. Not being a dooms day person, but this economy is overheated and it's mostly driven by tech, which is over represented in the S&P. VIX is pretty low right now, would be an interesting play when it starts spiking (and it will!) when the deck starts falling apart.
Best of luck and always do your own due diligence.

Before the perma-bulls go bonkers… Before the perma-bulls go bonkers… no, I’m not calling for a crash or bear market (yet).
But longer this bull runs, greater the odds of mean reversion.
Further we drift from 2009 without tagging the 300-month MA, more likely a sideways decade begins.
This will happen again.
You can't say we are "early" in the bull market. That simply is not true. Early is in the few years after the 2009 retouch of that very long term moving average. Can the indices still go up? Of course. But understand where you are in the cycle.
SPX: Banks beat, stocks peakThe US equity markets remained relatively resilient this week, despite ongoing concerns about trade policy developments. After last week’s slight retreat from its all-time high, the S&P 500 resumed its upward momentum early in the week, continuing to hover near record levels. The index reached a new highest level of 6,315 on Friday before pulling back slightly, closing the week at 6.296.
Bank earrings were in focus of investors during the previous week. Overall, Q2 reports from major U.S. banks showed resilience — better-than-expected earnings, strong interest income, and robust capital actions. So far, the finance sector has seen Q2 earnings rise around 13% y/y and 3,4% revenue growth. In addition, a stress test posted by Fed underpin confidence as all major banks, including JPMorgan and Citi showing resilience also under potential stress conditions. However, both bankers and investors held a cautious tone on macro/public policy risk.
Investors' confidence was additionally boosted by better than expected US macro data posted during the previous week. The inflation rate in June was 0,3% for the month and 2,7% on a yearly basis. At the same time, retail sales beat market expectations with an increase of 0,6% in June. As per analysts reports, currently 27 stocks included in the S&P 500 are trading at the all time highest levels. The ADM company, which is well known for producing Coca Cola, had a drop in the value of shares of 2% after the US President requested from the company to use real cane sugar in their popular drink.
From July 23st a composition of companies included in the S&P 500 index will be changed. A crypto company Block will be included, while the company Hess will be excluded from the index. Shares of the Blok surged by 10% on Friday, after the release of the news.

S&P500 INDEX (US500): Bullish Trend Continues
US500 updated a higher high this week, breaking a resistance
of a bullish flag pattern on a daily time frame.
I think that the market will rise even more.
Next goal for the bulls - 6359
❤️Please, support my work with like, thank you!❤️
I am part of Trade Nation's Influencer program and receive a monthly fee for using their TradingView charts in my analysis.

S&P500 (CASH500) SHORT - Head and shoulders Risk/reward = 5.8
Entry price = 6321.1
Stop loss price = 6333.5
Take profit level 1 (50%) = 6257.3
Take profit level 2 (50%) = 6234.9
Still waiting for confirmation on a few variables before I enter the trade.
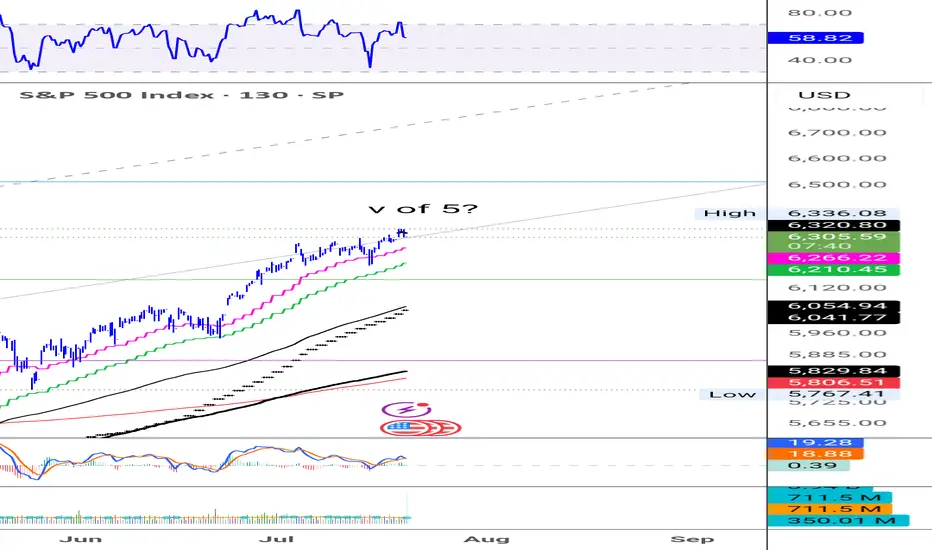
SPX - Time for a correction? To make it very simple,
Prices have been going up very nicely those last few weeks and months.
Everyone is happy but as we know that can't last.
NASDAQ:OPEN seems to be the latest pump and dump and it's just another sign of a coming correction imho.
Most stocks I've been following have reached resistance zone, levels where profit taking is very likely.
$S&P500 seems to have made a fifth wave, RSI divergence is present and confirming that.
It's difficult to pinpoint the exact top of course so I'm giving myself some leeway and use a small 1% stop loss in this case.
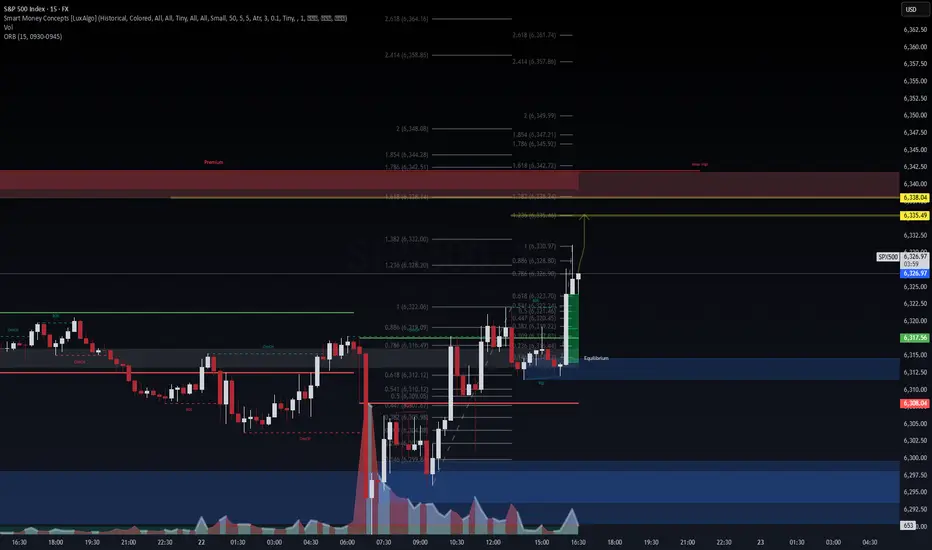
SellRejection Level
Daily Volume
Market Structure Shift
London Session
Trend Line Break
Untapped Order Point
Well...... I have no words to say, lets see what happens now. The Last Breath of Bulls
They came with horns of thunder,
hooves pounding gold from earth,
a decade’s dance in roaring winds,
each sunrise glinting mirth.
They charged through fields of candlesticks,
green banners held aloft,
dreams stacked on dreams, layer by layer,
voices rising, soft to rough.
But markets tire as all beasts do,
the grass runs dry and thin,
greed’s fattened calves now restless,
as silence crowds the din.
A tremor in the trading halls,
screens blinking red, then grey,
the bulls look up at iron clouds,
no dawn in this new day.
They stand, bewildered, heavy,
in fields now tinged with frost,
the horns that once carved futures bright,
bowed under the cost.
The end comes not with fury,
but a quiet pulling thread,
the bullish songs that once were sung,
now whispers of the dead.
Yet even as the bulls lie down,
the soil still holds the sun,
for from the hush of fallen hooves,
new seasons will be spun.

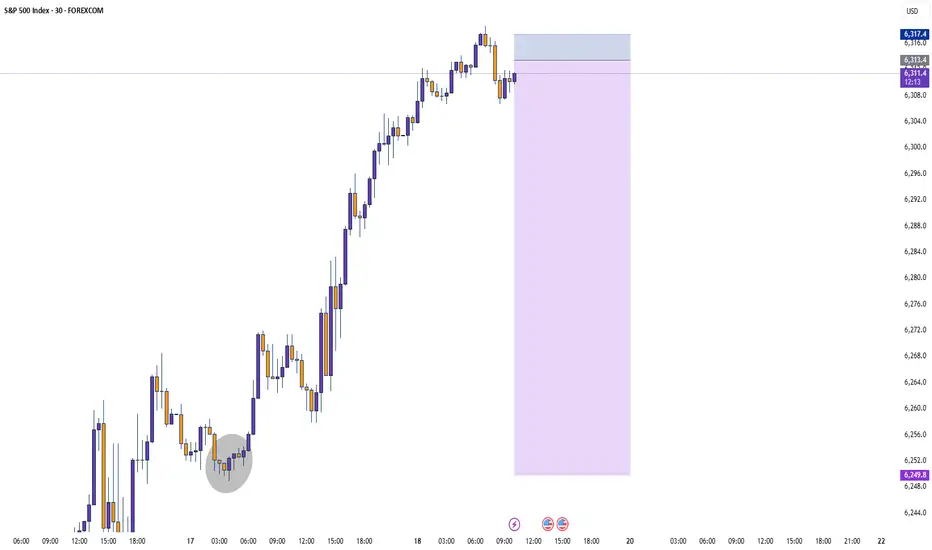
SPX500 Eyes Further Upside After Breaking to New HighSPX500 | Technical Overview
The price continued its bullish momentum after stabilizing above the 6283 support level, as anticipated. It has since posted a new all-time high (ATH) and is currently aiming for the next key resistance at 6341. A confirmed breakout above this level may open the path toward 6393.
On the downside, a break and sustained close below 6283 would shift the structure bearish in the short term, potentially targeting 6223.
Pivot line: 6283
Resistance: 6341 – 6393
Support: 6247 – 6223
previous idea:

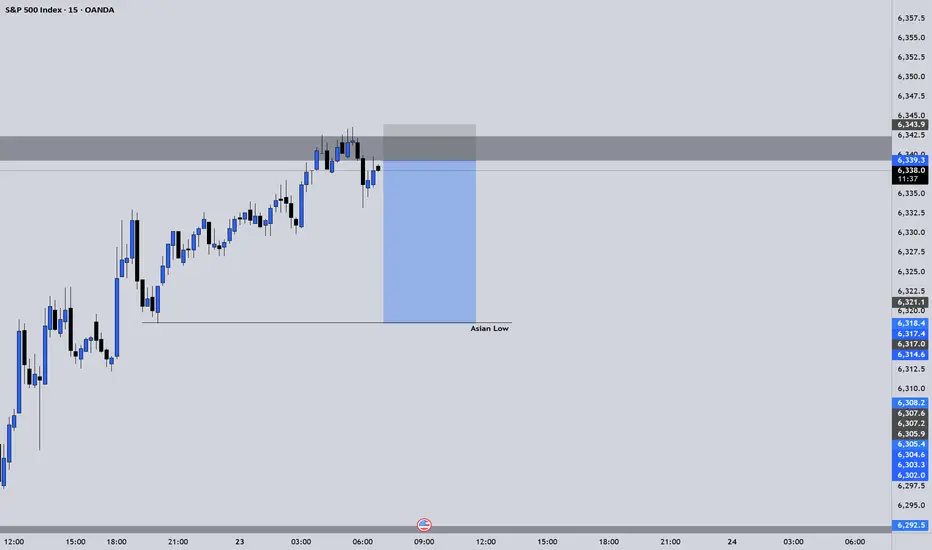
SPX500 ShortElite Analysis
This was a discretionary trade
Price came to structural liquidity
Executed trade on 5m
Targeting Asian low LP.