S&P 500 Index Most Bullish Signal In 15 YearsThis is why it is very clear, certain, that the stock market, the S&P 500 Index (SPX) is set to grow in the coming months. Last week produced the highest volume session, on the bullish side, since April/May 2010, that's 15 years. Back then, when this signal showed up, this index went to grow for years non-stop.
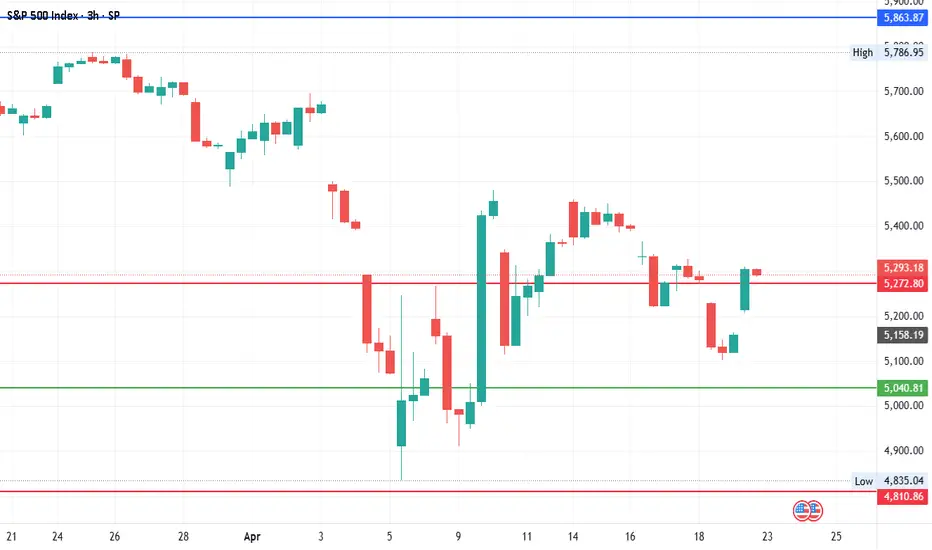
The SPX also produced the strongest weekly session in several decades, maybe the strongest week ever, and a bounce happened (support found) exactly at the 0.618 retracement Fib.
This is all we need to know. When the bulls enter the market and do so with force, it is because the market is set to grow. The correction produced decline of 21%. This is pretty standard. The fact that the correction happened really fast, it means that it will also have a fast end.
The low is in. The correction is over. The S&P 500 Index is set to grow.
You can be certain. If you have any doubts, just ask the chart.
Namaste.
SPIUSD trade ideas

The S&P 500 Is About to Drop — The Real Rally Comes in July!S&P 500 Market Outlook: Navigating the Path to a Bullish Breakout by June 2025
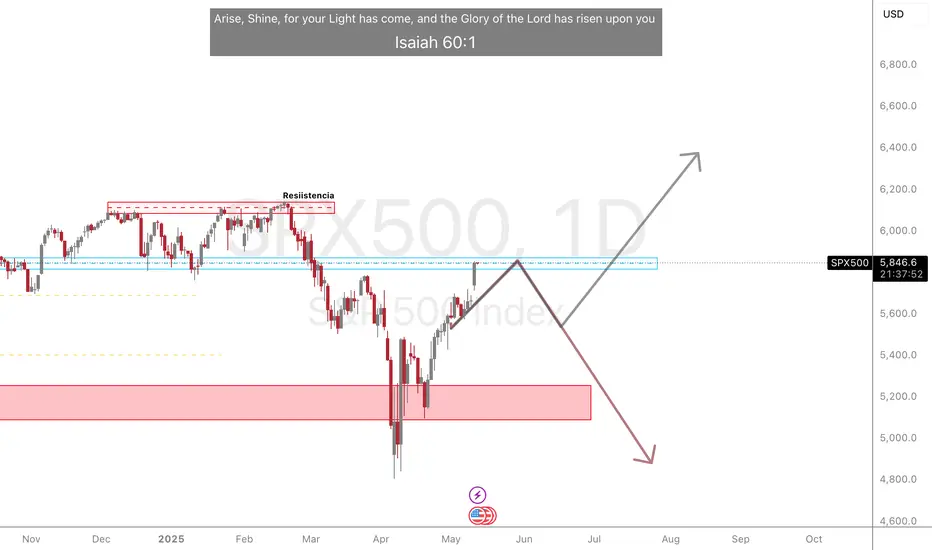
At Vital Direction, we are committed to delivering precise and forward-looking market analysis rooted in deep technical expertise. Our current evaluation of the S&P 500 indicates that the recent upward movement is not the beginning of a true bull market. Rather, it reflects a counter-trend rally that is approaching exhaustion. We firmly believe that the market is preparing for a significant decline in the short term, followed by a prolonged sideways consolidation, before initiating a genuine, powerful bull market in late June 2025.
Elliott Wave Analysis: A Classic Counter-Trend Structure
Our Elliott Wave analysis suggests that the S&P 500’s recent rally has been corrective in nature, comprised of only three waves — a classic hallmark of a counter-trend move. This pattern lacks the five-wave impulsive structure typically associated with sustainable bull markets. From our vantage point, this confirms that we remain in a larger corrective phase.
We anticipate that a sharp retracement is imminent, one that may unfold over the coming days and weeks, ultimately transitioning into a period of sideways price action until mid-to-late June 2025. Only thereafter do we foresee the conditions forming for a new all-time high and the emergence of a powerful bull leg.
Gann Theory Timing: Imminent Market Top
Our Gann timing model aligns precisely with this forecast. We have identified this week as a critical timing window for a potential top in the S&P 500. Once this pivot is confirmed, we expect the index to enter a steep downward phase. From a Gann perspective, this is a natural part of the market’s cyclical structure — a necessary clearing phase before the next long-term advance.
US Bond Yields: A Telling Risk-Off Signal
One of the most overlooked — yet crucial — factors supporting our bearish near-term view is the behaviour of US bond yields. Charts clearly show that bond yields are breaking out to new highs, a significant development that suggests institutional and “smart money” investors are positioning defensively. This is not a characteristic of a “risk-on” environment.
When yields rise, particularly amidst equity euphoria, it typically indicates that investors are seeking safety and yield rather than embracing equity risk. This divergence is a red flag that supports our conviction: the equity rally is unsustainable, and a meaningful correction is near.
Seasonality Supports the Retracement View
Historical seasonality trends for the S&P 500 further validate our analysis. Data indicates the following typical market behaviour:
Mid-May to Late May: Downtrend
Late May to Mid-June: Temporary uptrend
Mid-June to Late June: Another corrective phase
From Late June Onward: Start of the next major bullish cycle
This seasonal rhythm perfectly mirrors what we see technically: the market is preparing to reset before beginning a strong ascent in July 2025, building into a full-fledged bull market by late June.
The Broader Picture: Beyond US-China
While some market optimism has emerged on the back of renewed US-China tariff discussions, we caution against over-reliance on this narrative. The market appears to be ignoring the broader geopolitical context, including the absence of any clear tariff agreements between the US and Japan — another major global economic player.
The complexity of global trade negotiations introduces substantial uncertainty, which may continue to weigh on investor confidence. Until such macroeconomic factors are stabilised and digested by the market, we do not anticipate a truly risk-on environment.
The Road Ahead: A Strategic Pause Before Ascent
In conclusion, Vital Direction maintains its firm stance: the current market structure does not yet support the onset of a sustained bull market. A meaningful retracement is necessary and, indeed, healthy for the long-term health of the market. We expect this corrective period to unfold over the coming weeks and months, culminating in a sideways consolidation until late June 2025 — the point at which we foresee the S&P 500 transitioning into a highly bullish environment, with the potential to reach new all-time highs.
We will continue to monitor the technicals, macroeconomic developments, and global capital flows to provide our clients with the most accurate and actionable insights. The bull is coming — just not yet.

Bullish S&P500The S&P 500 is showing strong behavior again today, which suggests investors remain optimistic about the market's overall direction.
That said, the price is starting to look overextended from the 10 EMA and is now touching the Bollinger Bands. This usually signals that a pullback is likely, even if it's just a minor one to the 10 EMA. Of course, we can never predict exactly how the market will move—but when that pullback happens, it often brings better entry opportunities on individual stocks, helping us position ourselves more effectively.
As always, remember that trading carries risk. Be mindful with your entries and apply solid risk and money management to protect your capital and avoid being wiped out by unexpected market moves.

U.S. Bulls Take Charge: S&P 500 Set to Break OutHello,
📊 S&P 500 Market Outlook – Pro-Bullish Perspective
🔥 Market Recap: The S&P 500 recently saw a significant dip, marking a 1-year low at 4805.92, largely attributed to the shockwaves caused by President Trump’s sweeping tariff announcement on April 2. This move sent markets into a tailspin, creating heightened volatility levels not seen since the early pandemic days.
However, savvy traders recognized opportunity amidst the panic and entered strategic buy zones around those lows. Since then, the index has managed to stabilize above key technical levels, signaling potential bullish momentum building from the ground up.
🧭 Current Key Technical Levels to Watch:
1W Pivot Point (PP): ✅ Holding above 5224.13
1D Pivot Point (PP): ⚠️ Testing resistance at 5297.05
1M Strong Support/Resistance: ⛔ Acting as resistance at 5329.31
🚀 Bullish Confirmation Pathway:
To fully confirm a bottom-up bullish reversal, we’re looking for:
✅ Sustained close above the 1D PP @ 5297.05
✅ Break and hold above the 1M Resistance @ 5329.31
✅ Momentum toward the 1Y PP @ 5550.97
If these levels are conquered with conviction, it opens the door for an extended upside move toward 5878.58, aligning with a broader bullish sentiment.
🛑 Cautionary Downside Scenario:
Although currently less likely, a failure to maintain support above the 1W PP @ 5224.13 could reopen downside risk in the short term. We remain watchful of that level as a bull-bear pivot.
🌐 Macro Overview – Tariff Shock & Earnings Spotlight:
Trump’s abrupt tariff move has reshuffled the global economic deck, and investors are still processing its implications.
The S&P 500 is currently down ~14% from its February highs, but showing resilience.
Earnings season is now center stage, with major players like Tesla, Alphabet, IBM, and Boeing under the microscope.
⚠️ Volatility Index (VIX) is down from post-tariff highs (~60) to ~30, still elevated from the long-term median of 17.6, signaling cautious optimism.
💬 CEO Sentiment Matters:
As JJ Kinahan from IG North America noted:
“The view of CEOs going forward has never been more important.”
With traditional guidance uncertain, investors are leaning on transparent, scenario-based outlooks like United Airlines’ “dual roadmap” approach.
🔋 Magnificent Seven on Watch:
Alphabet: -20% YTD
Tesla: -40% YTD
These leaders are key sentiment barometers. If they bounce, the broader market is likely to follow.
🏛️ Fed & Trump Tensions:
Trump recently stated that Fed Chair Jerome Powell’s termination “cannot come fast enough,” pushing for rate cuts.
Powell, however, remains cautious, citing the need for more economic data before acting.
✍️ Final Note – A Cooling Tariff War?
💬 According to Trump’s latest statement, the tone around tariffs is beginning to cool, hinting at possible de-escalation.
This development adds further bullish tailwinds to the broader market outlook.
✅ Summary:
We are leaning bullish here with the base-building process in motion. Key levels are aligning, volatility is easing, and clarity from corporate earnings could be the catalyst to propel markets upward.
Watch for a clean breakout above 5329 — that’s where the real confirmation begins. Eyes on the prize: 5878.58 👀📈
The Support and Resistance outlined in green and red are the respective support/resistance for this pair currently for 1M-1Y timeframes!
No Nonsense. Just Really Good Market Insights. Leave a Boost
TradeWithTheTrend3344

S & P Index - Volatality Magic StudyThis is for the study purpose based on the index volatility and the level are based on no of points it can move within the short span of time.
Quick preview 5-13The Market is still 50+ points from the Bollinger Band, now that it's moved up. However, we're in a channel and a breakdown of the channel may be significant. Trend is still up and the bias is as well. If we are to break below the 200 ma and the 18 weekly, bears would have to step in very soon. Otherwise we will continue to push up.

US500 - Let the Bulls Strive!Hello TradingView Family / Fellow Traders. This is Richard, also known as theSignalyst.
📈US500 has been overall bullish trading within the rising channel marked in red.
Moreover, the blue zone is a strong support and structure!
🏹 Thus, the highlighted blue circle is a strong area to look for buy setups as it is the intersection of support and lower red trendline acting as a non-horizontal support.
📚 As per my trading style:
As #US500 approaches the blue circle zone, I will be looking for bullish reversal setups (like a double bottom pattern, trendline break , and so on...)
📚 Always follow your trading plan regarding entry, risk management, and trade management.
Good luck!
All Strategies Are Good; If Managed Properly!
~Rich
Disclosure: I am part of Trade Nation's Influencer program and receive a monthly fee for using their TradingView charts in my analysis.

S&P500 Alert! Entering a medium-term SELL ZONE!The S&P500 index (SPX) has recovered the 0.786 Fibonacci retracement level, limiting the Trade War losses considerably. Trading this week above its 1W MA50 (blue trend-line), the index has confirmed that it resumed its long-term bullish trend.
On he medium-term though attention is needed as we're headed towards a range, which in the past 10 years has historically been an interim Sell Zone. That's the 0.786 - 0.9 Fibonacci range, which since the 2016 correction, it has always rejected the uptrend of a 1W MA200 (orange trend-line) led recovery.
On 3 out of 3 occasions so far (April 2016, June 2020, July 2023), every time the price tested the 0.9 Fib, it got rejected back to its 1W MA50 (blue trend-line). In 2023 the pull-back bottomed in 3 months but in 2020 and 2016 it took considerably less.
As a result, we call for caution near the 0.9 Fib for a potential medium-term pull-back but on the long-term the bullish trend is intact and historically it targets a minimum +27.74% from the All Time High (ATH), which is translated into a 7800 Target.
-------------------------------------------------------------------------------
** Please LIKE 👍, FOLLOW ✅, SHARE 🙌 and COMMENT ✍ if you enjoy this idea! Also share your ideas and charts in the comments section below! This is best way to keep it relevant, support us, keep the content here free and allow the idea to reach as many people as possible. **
-------------------------------------------------------------------------------
💸💸💸💸💸💸
👇 👇 👇 👇 👇 👇

Market has shifted to a lower rising channel. Correction dueI believe the market has discounted the tariff effect and now shifted to a lower channel.
If that is the case, then a normal correction of 5% is imminent, as it encounters multiple resistance trendlines. The inflation (CPI) numbers on 13 May could be a catalyst

S&P500 Short: Update on wave counts, Completion of WXYThis is my 3rd attempt to call the correction peak for S&P500 or Nasdaq (I use them interchangeably). From the previous short idea using Nasdaq, I mentioned that the reason for the invalidation of the previous idea is due to the last wave 5 of C of Y to extend into a 5-wave structure.
Over here, the short position will be stopped out if a new high above wave Y is hit. I offered 2 conservative targets in this short idea and suggests that one can reduce position and shift stop loss when the first conservative target is reached. I also mention that if this WXY wave structure is the correct call, then the big picture is really that S&P500 will crash below 4800.
Good luck!

refers to all US indexAll analyses done by according to most recent fundamental news like what is President Trump saying.

S&P500 Chasing a Retrace - Waiting for Equilibrium After Rally🗓️ Yesterday, I mentioned watching the S&P 500 for a retrace to find a potential long entry. But with the US-China tariff agreement announced, the market rallied hard 🚀—a clear positive for stocks. We didn’t get much of a pullback, and right now, I see the S&P 500 as overextended. I’m not looking to jump in at these premium levels. Instead, I’m waiting for a Fibonacci retrace back down into equilibrium on the current swing for a better opportunity. 👀
My plan: I’ll watch for a bearish break of structure to signal a retrace, then monitor price action as we approach support. If support holds and we get a bullish break of structure, that’s when I’ll look to get involved. 🔄
Just sharing my idea here—this isn’t financial advice! 📢

SPX500 Waiting for the movement...the blue area is the key to knowing exactly what position to take.
S&P 500 index Wave Analysis – 12 May 2025
- S&P 500 index broke resistance area
- Likely to rise to resistance level 5930.00
S&P 500 index recently broke the resistance area between the resistance levels 5800.00 (top of wave 4 from March), 5700.00 (which stopped wave 1 at the start of May) and the 61.8% Fibonacci correction of the downward impulse from February.
The breakout of this resistance area is aligned with the short-term impulse wave 3 of the intermediate impulse wave (3) from April.
S&P 500 index can be expected to rise to the next resistance level 5930.00, former support from January and February.

We Have a Full Pattern into The Target BoxI am now looking for a 5-wave pattern to develop to the downside, followed by a 3-wave retrace, that in the coming weeks can take us back out of the Target box to the downside. Price must breach the 5578 area to give us any indication the pattern to the upside below is cracking.

S&P 500 – an ascending channel on Daily Daily Chart (D1) :
I'm observing an ascending channel, with a potential manipulation near its lower boundary.
If that happens, we may see the formation of a bullish pivot point.
Hourly Chart (H1) :
I've marked the boundaries of the daily channel on H1.
There’s an unfilled gap below, and price might revisit that area.
I’m watching the 5690.7 level closely — it could act as a key zone for potential long setups.
📈 If 5690.7 holds , possible long targets include:
🎯 A break above the local high at 5848
🎯 The upper boundary of the channel, which closely aligns with the anticipated bullish pivot point target
📉 If price fails to hold above 5690.7 and breaks lower,
I’ll start considering short scenarios and will update this idea accordingly.

Continuation of bullish trendSeems that the trade deal between China and USA is behaving well with the general market, in my opinion the market will continue up for a while, however we need to be aware that at some point will need to breath and at least pull back to one of the EMAs, plus since it is now touching the top of the BB it will most likely pull-back at some point in the future, that doesn't mean it will reverse, but instead, give us another opportunity to enter the markets again, in line with the general market and at a good position to capitalize from the market movement.

SPX did the thing....How did we miss this? This is using price at market close data - but it basically did the whole cycle since the 2022 bottom up until now...
This stuff is always fascinating to me to see.

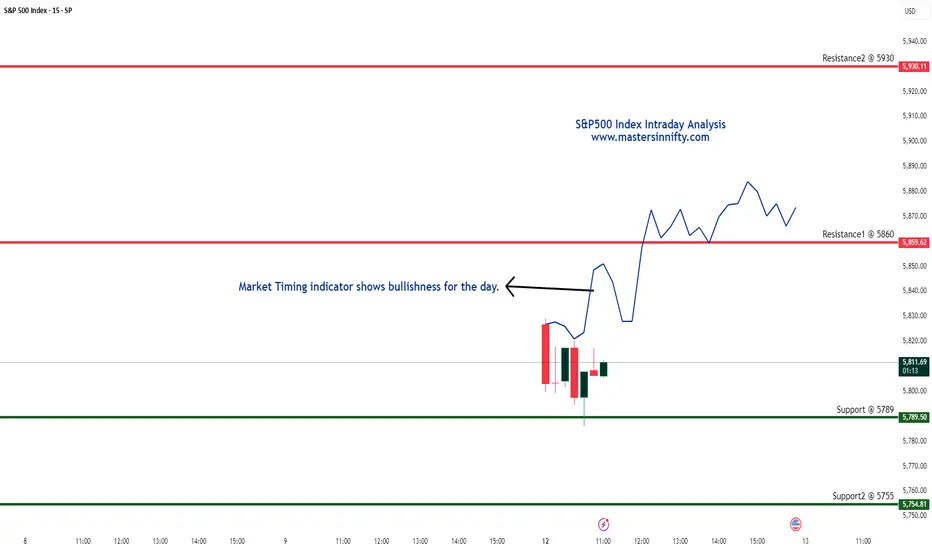
S&P500 Index Intraday Trend Analysis for May 12, 2025The S&P 500 Index is displaying bullish indications for the day. Key support levels are observed at 5789 and 5755, while resistance is expected around 5860 and 5930.
Please note, this is solely my personal view. Traders are advised to conduct their own technical analysis and ensure proper risk management before making any trading decisions.
SPX – Triple Breakout: Inverse H&S + EMA 200 + Ichimoku CloudSPX has confirmed a powerful bullish breakout with three confluences:
1. Inverse Head & Shoulders breakout
2. 200 EMA breakout
3. Ichimoku Cloud breakout
This alignment of structure, trend, and momentum indicators suggests a potential continuation move toward 6150 in the coming weeks.
Trade View:
Entry: On breakout retest or continuation
Target: 6150
Stop Loss: Below neckline or EMA200 depending on risk tolerance
Bias: Strongly bullish

SPX: US-China tariffs talkOne of the most important weekly events was the FOMC meeting, where its members held the interest rates unchanged for one more time. Many analysts are in agreement that the Fed made the right decision, without jumping-into-conclusion regarding the potential negative effects of trade tariffs. However, this topic was addressed by the Fed Chair Powell, at his after-the-meeting address to the public, where he noted a confidence that the Fed will react immediately in case that stronger negative effects of trade tariffs reflect in the economy. Here, he noted once again the dual mandate of the Fed - to keep full unemployment and inflation at the targeted 2%. The market reacted positively to his speech, bringing the US equity markets to the higher levels. The S&P 500 gained during the week, from 5.586 to 5.713. However, Friday's trading session was with a negative sentiment, considering forthcoming US-China tariffs talk, expected to start soon.
At the same time, the US managed to settle trade tariffs at the level of 10% with the United Kingdom. Analysts are commenting that this might be a general level for the majority of other countries. However, the US President published on social networks that he hopes to settle tariffs with China at 80%, which is still too high. Considering forthcoming talks between two governments and also taking into account that China is one of the most important trading partners with the US, the market sensitivity will continue to be in an on-off mode. This means that the market volatility will most certainly continue in the coming period.

Bollinger Band Target 5870Now that we've reset the RSI on all the mid time frames, the chance of getting to the BB after open is high. For bears, this may be a day of capitulation. We are over all the important MA's but the rest of the week has to hold above them for it to remain bullish.

05/05 SPX Weekly Playbook - GEX Zone Outlook🔮 What-If Scenarios for This Week – Based on GEX Structure until Firday
Last week’s market momentum pushed the S&P 500 up by almost 3%, effectively erasing the price gap left behind on Liberation Day. The index also strung together nine straight days of gains—something we haven’t seen since late 2004.
Meanwhile, implied volatility dropped significantly, with the VIX touching its lowest level since the holiday, falling to around 22.5.
Several factors seem to have fueled this bullish tone, including a more measured approach from Trump on trade policies and strong quarterly results from major tech names like Microsoft and Meta.
Still, the nature of the buying raises questions—was this a thoughtful rotation, or just a broad sweep of optimism?
~~~~~~~~~~~~~~~~~~~~~~~~~~~~~~~~~~~~~~~~~~
🔄 Chop Zone: 5650 – 5670 (wide transition zone)
🔹 Gamma Flip: 5615
🔺 Key Call Wall: 5725 (5800 potential shift)
🔻 Key Put Wall: 5500 (5400 major support below)
🔼 Upside Path
IF > 5670 → transition cleared →
➡️ 5700 stall / reaction
IF > 5725 → call wall breached →
➡️ Path to 5750 / 5775 → stall at 5800 (largest net call OI)
IF > 5800 → gamma resistance breaks down →
➡️ 5825/5850 zone opens up
🔽 Downside Path
IF < 5615 → gamma flip triggered →
➡️ 5500 = battle zone (massive put wall + high negative GEX)
IF < 5500 → negative gamma squeeze likely →
➡️ Stall zone: 5450 → flush to 5400
IF < 5400 → high-volatility regime →
➡️ Possible acceleration to 5375 / 5340 depending on IV spike
⚖️ Neutral Setup
IF 5650–5670 holds → dealer hedging = balanced →
➡️ Ideal for non-directional spreads / theta plays
➡️ Wait for breakout confirmation above 5670 or below 5615
~~~~~~~~~~~~~~~~~~~~~~~~~~~~~~~~~~~~~~~~
🔍 Final Thoughts
We’ve seen a sharp rally since the Trump trade war scare, with barely any meaningful pullback. The market appears to be looking for one—as a breath. Based on current GEX positioning, there’s significantly more downside hedging than upside, especially in the mid-term May expirations.
That doesn’t necessarily mean we crash—but it does mean that moves lower can accelerate faster, while upward breakouts may require more energy or time. In this environment, consider:
Bearish or neutral spreads (put debit spreads, call credit spreads)
Volatility-based strategies
Avoiding naked upside trades unless we see a strong reclaim of 5725+
Stay safe and adapt—GEX doesn’t tell direction, but it does tell where the fire might start, beacuse of reflexting to hedging activity.
