S&P's "hugely overbought" towards 6375!1). Position Volume dropping! 2). Big institutions (Banks & Insurance) have backed off on higher Risk positions! 3). Huge resistance at .728 fib & trend! 4). Trump tariff talk is likely adding to a fall as well! 5). We're looking for a "SELL" trade @ 6375, since buying is too risky at the moment...Good Luck!
SPX trade ideas

US500 Swing short tradeUS500 index is on the verge of major drop. I expect the price to sink in the coming weeks, that's why this will be a swing trade. I expect to reach my main target of $6000 around mid/end of August, with a second short entry once we will start to drop and retrace till my key level.

You Are NOT Your P<here was once a tree that stood alone at the edge of a cliff, overlooking the vast sea.
Some days, the sun shone bright, the winds gentle, the water below calm and peaceful. Other days brought heavy storms, fierce winds, crashing waves, rain so relentless it seemed the skies might never clear again. The seasons came and went. The skies changed again and again. But the tree never thought of itself differently because of the weather.
It did not feel more valuable on a sunny day. It did not feel broken or weak when storms battered its branches. The tree simply stayed rooted. It understood something quietly powerful - “ the weather was never personal. It wasn’t about the tree.”
The tree remained, growing slowly over years, not because the conditions were always perfect, but because it had learned to stand through all of it.
This is something most traders forget.
We step into the market with good intentions, hungry to learn, eager to succeed. But somewhere along the way, we make a mistake. We let our self-worth become tied to the numbers on the screen.
A green day makes us feel smart, in control, like we’ve cracked the code. A red day, on the other hand, shakes us to the core, makes us question our place, our skill, even our worth, like we never belonged here at all.
The danger isn’t just in the financial losses. It’s in how we let the market shape how we see ourselves.
But here’s the truth the market won’t tell you upfront: the market doesn’t know who you are, and it doesn’t care . It doesn’t remember what you did yesterday, how many hours you’ve spent learning, or how desperately you want this to work.
The market moves how it moves. Sometimes it moves with you, sometimes it moves against you. It’s neither a punishment, nor a reward. It’s just movement.
Your wins don’t make you superior. Your losses don’t make you dumb. Both are part of the same cycle, and part of the environment you’ve chosen to work in. If you build your self-image on the outcome of your last trade, you’ll forever live on a fragile edge. Every swing will shake you. Every drawdown will feel like a verdict on who you are.
But trading isn’t about who you are today. It’s about who you become over time.
Your job isn’t to seek approval from a system built on randomness and probability. Your job is to build yourself on steadier ground. To stay rooted, like a tree. To let your process define you, not your P&L.
The storms will come. They always do. Volatility, uncertainty, periods where nothing seems to work - these are all part of the environment. The traders who survive are NOT the ones who try to outmuscle the market. They are the ones who protect their capital, their energy, and their mindset through it all.
They understand that being steady is more important than being brilliant - that surviving is more valuable than being right.
Detach your self-worth from the swings. Build your identity on discipline, patience, humility - the quiet habits you control. These are your roots. And when the storm rolls in, they’re what keep you grounded.
When you stop tying your self-image to your short-term results, you begin to see the market more clearly. You stop forcing trades to make yourself feel better. You stop chasing moves to prove something. You start letting your process do its work, even when it feels slow.
You start to realise that progress in trading is quiet and unfolds slowly, almost invisibly, much like a tree growing through the seasons. Small shifts accumulate over time, often going unnoticed, until one day you look back and truly see how far you’ve come.
When you understand this, red days lose their sting. Green days lose their arrogance. Both just become part of the weather. You adapt, endure, and move forward.
You don’t measure yourself by how much you made this week, this month, or even this year. You measure yourself by how well you followed your process , how calmly you handled the volatility, and how patient you remained when there was nothing to do.
The market doesn’t ask for perfection - only consistency. And consistency comes from within, not from chasing highs or avoiding lows, but from standing firm through both.
Like the tree on the cliff, your strength is not in avoiding the weather. Your strength is in understanding that the weather will pass. It always does. Your roots - your process, your discipline, your patience, are what keep you standing until it does.
⦿ Learn to protect your energy.
⦿ Learn to lose without self-doubt.
⦿ Learn to win without ego.
⦿ Learn to wait without fear.
⦿ Learn to wait patiently
Your worth is not in your wins or losses. It’s in how you carry yourself through both.
Stay rooted.
The seasons will change.
And when they do, you’ll still be here, stronger than you were before.
S&P 500 (CASH500) - Double Top H1Risk/reward = 2.7
Entry price = 6388.4
Stop loss price = 6399.7
Take profit level 1 (50%) = 6360.4
Take profit level 2 (50%) = 6352
Also, waiting on confirmation on some variables

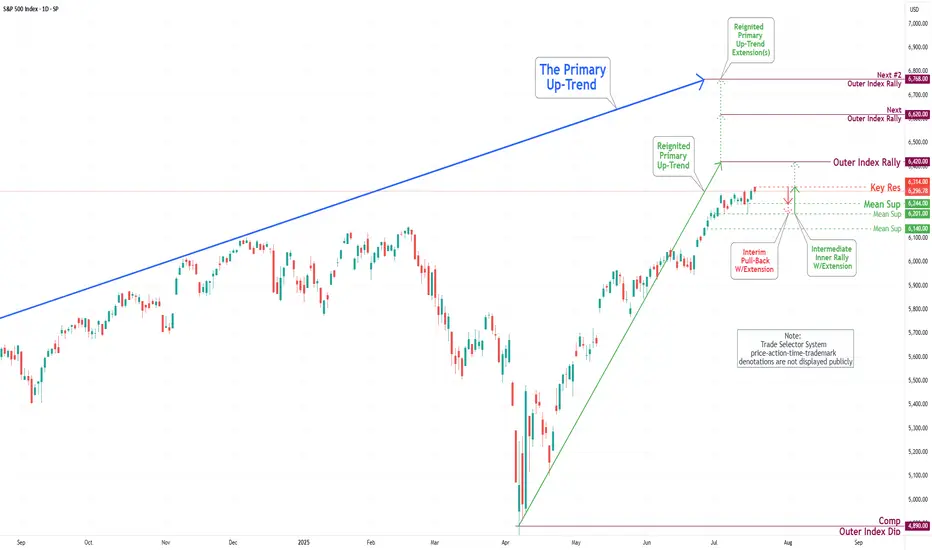
S&P 500 Daily Chart Analysis For Week of July 18, 2025Technical Analysis and Outlook:
During the current trading week, the S&P 500 Index has demonstrated a predominantly upward trajectory. It has successfully retested the Mean Support level at 6200 and established a new Key Resistance level at 6314. Currently, the index displays a bullish sentiment, with the objective for the Outer Index Rally set at 6420.
Nevertheless, it is essential to recognize that the current price action may result in a decline, potentially leading to a retest of the Mean Support at 6244 and extending to the Mean Support at 6201. Following this potential downward movement, it is anticipated that the index will resume its upward trend, driving the price action towards the Key Resistance level at 6314 and ultimately achieving the Outer Index Rally target of 6420.
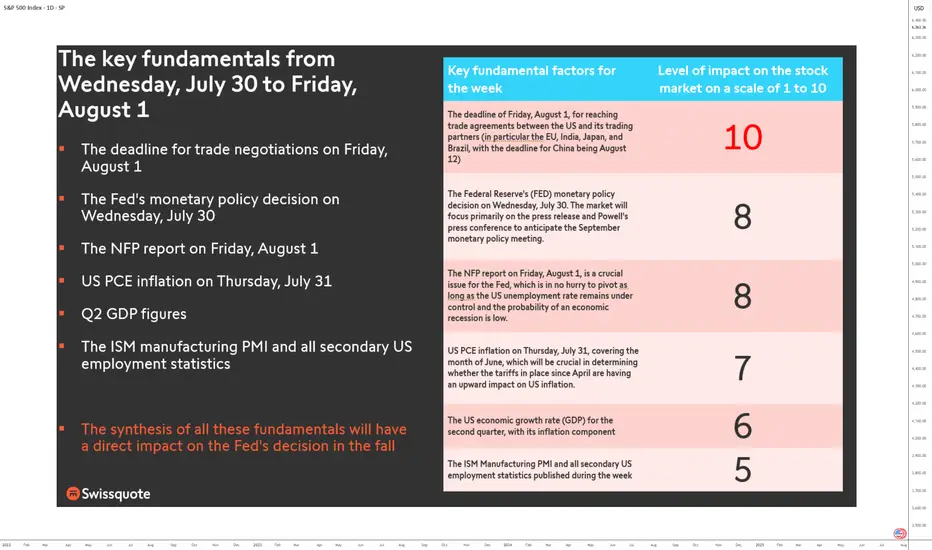
FUNDAMENTALS: THE WEEK OF TRUTH IS COMING!This is a high-stakes, high-pressure week for markets as the final days of July approach. Between Wednesday, July 30, and Friday, August 1, all the market-moving fundamentals are concentrated in a three-day window. It’s a stress test for the U.S. equity market: either it extends its bullish trend, or it enters a much-needed consolidation phase.
Three days. No more. Catalysts are so tightly packed they could shake even the steadiest traders. We’re looking at a full-spectrum stress test—monetary, economic, and geopolitical. Why so crucial? Because every major macro driver is converging in an ultra-condensed timeframe: the trade deal deadline with U.S. partners, the Fed’s policy decision, GAFAM earnings, PCE inflation, the NFP jobs report, Q2 GDP figures, and key technical barometers—all as we enter the seasonally weaker August-September period.
1) Wednesday, July 30 – The Monetary Moment of Truth
The week opens with a critical event: the Fed’s monetary policy meeting. It’s not just about rates, but forward guidance. The market stands at a crossroads. Either the Fed signals a dovish pivot for late 2025, and risk appetite returns—or it delays action, and the S&P 500, already stretched (Shiller PE Ratio back to end-2021 levels), enters a correction.
At the same time, GAFAM kick off their earnings season. U.S. tech remains the market’s beating heart. If these giants disappoint, the sector will drag down the entire market. Remember, tech accounts for 35% of the S&P 500’s weight.
2) Thursday, July 31 – PCE Inflation Decides the Direction
Next up is the Fed’s preferred inflation metric: core PCE. A critical indicator. If inflation ticks up, the autumn rate-cut narrative falls apart. Add in the second estimate of Q2 GDP and earnings from the next GAFAM batch, and Thursday becomes a pivotal day for the S&P 500. The key question: will core PCE inflation rebound, possibly influenced by tariff impacts?
3) Friday, August 1 – The Verdict: NFP and Trade Talks
NFP jobs report + trade negotiation deadline = explosive combo. By Friday, markets will have priced in the Fed, inflation, and earnings. What’s left? U.S. labor. Weak numbers could revive recession fears. Strong ones might push back the Fed’s easing timeline.
Also on the radar: trade talks. The August 1 deadline could spike volatility. And let’s not forget the China-specific deadline on Tuesday, August 12.
Conclusion: No Room for “TACO”
There’s no margin for error. No room for “TACO” (Trump Always Chickens Out). This market must deliver across the board—or the current overvaluation will be left with no safety net. The July 30 week is a true fundamental stress test. And the consequences will be swift.
DISCLAIMER:
This content is intended for individuals who are familiar with financial markets and instruments and is for information purposes only. The presented idea (including market commentary, market data and observations) is not a work product of any research department of Swissquote or its affiliates. This material is intended to highlight market action and does not constitute investment, legal or tax advice. If you are a retail investor or lack experience in trading complex financial products, it is advisable to seek professional advice from licensed advisor before making any financial decisions.
This content is not intended to manipulate the market or encourage any specific financial behavior.
Swissquote makes no representation or warranty as to the quality, completeness, accuracy, comprehensiveness or non-infringement of such content. The views expressed are those of the consultant and are provided for educational purposes only. Any information provided relating to a product or market should not be construed as recommending an investment strategy or transaction. Past performance is not a guarantee of future results.
Swissquote and its employees and representatives shall in no event be held liable for any damages or losses arising directly or indirectly from decisions made on the basis of this content.
The use of any third-party brands or trademarks is for information only and does not imply endorsement by Swissquote, or that the trademark owner has authorised Swissquote to promote its products or services.
Swissquote is the marketing brand for the activities of Swissquote Bank Ltd (Switzerland) regulated by FINMA, Swissquote Capital Markets Limited regulated by CySEC (Cyprus), Swissquote Bank Europe SA (Luxembourg) regulated by the CSSF, Swissquote Ltd (UK) regulated by the FCA, Swissquote Financial Services (Malta) Ltd regulated by the Malta Financial Services Authority, Swissquote MEA Ltd. (UAE) regulated by the Dubai Financial Services Authority, Swissquote Pte Ltd (Singapore) regulated by the Monetary Authority of Singapore, Swissquote Asia Limited (Hong Kong) licensed by the Hong Kong Securities and Futures Commission (SFC) and Swissquote South Africa (Pty) Ltd supervised by the FSCA.
Products and services of Swissquote are only intended for those permitted to receive them under local law.
All investments carry a degree of risk. The risk of loss in trading or holding financial instruments can be substantial. The value of financial instruments, including but not limited to stocks, bonds, cryptocurrencies, and other assets, can fluctuate both upwards and downwards. There is a significant risk of financial loss when buying, selling, holding, staking, or investing in these instruments. SQBE makes no recommendations regarding any specific investment, transaction, or the use of any particular investment strategy.
CFDs are complex instruments and come with a high risk of losing money rapidly due to leverage. The vast majority of retail client accounts suffer capital losses when trading in CFDs. You should consider whether you understand how CFDs work and whether you can afford to take the high risk of losing your money.
Digital Assets are unregulated in most countries and consumer protection rules may not apply. As highly volatile speculative investments, Digital Assets are not suitable for investors without a high-risk tolerance. Make sure you understand each Digital Asset before you trade.
Cryptocurrencies are not considered legal tender in some jurisdictions and are subject to regulatory uncertainties.
The use of Internet-based systems can involve high risks, including, but not limited to, fraud, cyber-attacks, network and communication failures, as well as identity theft and phishing attacks related to crypto-assets.
S&P 500 (CASH 500) SHORT - Double top H8Risk/reward = 4.1
Entry price = 6343.3
Stop loss price = 6365.3
Take profit level 1 (50%) = 6268.1
Take profit level 2 (50%) = 6232.1
Still waiting on some variables on checklist to be confirmed before I enter the trade.

The Empirical Validity of Technical Indicators and StrategiesThis article critically examines the empirical evidence concerning the effectiveness of technical indicators and trading strategies. While traditional finance theory, notably the Efficient Market Hypothesis (EMH), has long argued that technical analysis should be futile, a large body of academic research both historical and contemporary presents a more nuanced view. We explore key findings, address methodological limitations, assess institutional use cases, and discuss the impact of transaction costs, market efficiency, and adaptive behavior in financial markets.
1. Introduction
Technical analysis (TA) remains one of the most controversial subjects in financial economics. Defined as the study of past market prices and volumes to forecast future price movements, TA is used by a wide spectrum of market participants, from individual retail traders to institutional investors. According to the EMH (Fama, 1970), asset prices reflect all available information, and hence, any predictable pattern should be arbitraged away instantly. Nonetheless, technical analysis remains in widespread use, and empirical evidence suggests that it may offer predictive value under certain conditions.
2. Early Empirical Evidence
The foundational work by Brock, Lakonishok, and LeBaron (1992) demonstrated that simple trading rules such as moving average crossovers could yield statistically significant profits using historical DJIA data spanning from 1897 to 1986. Importantly, the authors employed bootstrapping methods to validate their findings against the null of no serial correlation, thus countering the argument of data mining.
Gencay (1998) employed non-linear models to analyze the forecasting power of technical rules and confirmed that short-term predictive signals exist, particularly in high-frequency data. However, these early works often omitted transaction costs, thus overestimating potential returns.
3. Momentum and Mean Reversion Strategies
Momentum strategies, as formalized by Jegadeesh and Titman (1993), have shown persistent profitability across time and geographies. Their approach—buying stocks that have outperformed in the past 3–12 months and shorting underperformers—challenges the EMH by exploiting behavioral biases and investor herding. Rouwenhorst (1998) confirmed that momentum exists even in emerging markets, suggesting a global phenomenon.
Conversely, mean reversion strategies, including RSI-based systems and Bollinger Bands, often exploit temporary price dislocations. Short-horizon contrarian strategies have been analyzed by Chan et al. (1996), but their profitability is inconsistent and highly sensitive to costs, timing, and liquidity.
4. Institutional Use of Technical Analysis
Contrary to the belief that TA is primarily a retail tool, it is also utilized—though selectively—by institutional investors:
Hedge Funds: Many quantitative hedge funds incorporate technical indicators within multi-factor models or machine learning algorithms. According to research by Neely et al. (2014), trend-following strategies remain a staple among CTAs (Commodity Trading Advisors), particularly in futures markets. These strategies often rely on moving averages, breakout signals, and momentum filters.
Market Makers: Although market makers are primarily driven by order flow and arbitrage opportunities, they may use TA to model liquidity zones and anticipate stop-hunting behavior. Order book analytics and technical levels (e.g., pivot points, Fibonacci retracements) can inform automated liquidity provision.
Pension Funds and Asset Managers: While these institutions rarely rely on TA alone, they may use it as part of tactical asset allocation. For instance, TA may serve as a signal overlay in timing equity exposure or in identifying risk-off regimes. According to a CFA Institute survey (2016), over 20% of institutional investors incorporate some form of technical analysis in their decision-making process.
5. Adaptive Markets and Conditional Validity
Lo (2004) introduced the Adaptive Markets Hypothesis (AMH), arguing that market efficiency is not a binary state but evolves with the learning behavior of market participants. In this framework, technical strategies may work intermittently, depending on the ecological dynamics of the market. Neely, Weller, and Ulrich (2009) found technical rules in the FX market to be periodically profitable, especially during central bank interventions or volatility spikes—conditions under which behavioral biases and structural inefficiencies tend to rise.
More recent studies (e.g., Moskowitz et al., 2012; Baltas & Kosowski, 2020) show that momentum and trend-following strategies continue to deliver long-term Sharpe ratios above 1 in diversified portfolios, particularly when combined with risk-adjusted scaling techniques.
6. The Role of Transaction Costs
Transaction costs represent a critical variable that substantially alters the net profitability of technical strategies. These include:
Explicit Costs: Commissions, fees, and spreads.
Implicit Costs: Market impact, slippage, and opportunity cost.
While early studies often neglected these elements, modern research integrates them through realistic backtesting frameworks. For example, De Prado (2018) emphasizes that naive backtesting without cost modeling and slippage assumptions leads to a high incidence of false positives.
Baltas and Kosowski (2020) show that even after accounting for bid-ask spreads and market impact models, trend-following strategies remain profitable, particularly in futures and FX markets where costs are lower. Conversely, high-frequency mean-reversion strategies often become unprofitable once these frictions are accounted for.
The impact of transaction costs also differs by asset class:
Equities: Higher costs due to wider spreads, especially in small caps.
Futures: Lower costs and higher leverage make them more suitable for technical strategies.
FX: Extremely low spreads, but high competition and adverse selection risks.
7. Meta-Analyses and Recent Surveys
Park and Irwin’s (2007) meta-analysis of 95 studies found that 56% reported significant profitability from technical analysis. However, profitability rates dropped when transaction costs were included. More recent work by Han, Yang, and Zhou (2021) extended this review with data up to 2020 and found that profitability was regime-dependent: TA performed better in volatile or trending environments and worse in stable, low-volatility markets.
Other contributions include behavioral explanations. Barberis and Thaler (2003) suggest that TA may capture collective investor behavior, such as overreaction and underreaction, thereby acting as a proxy for sentiment.
8. Limitations and Challenges
Several methodological issues plague empirical research in technical analysis:
Overfitting: Using too many parameters increases the likelihood of in-sample success but out-of-sample failure.
Survivorship Bias: Excluding delisted or bankrupt stocks leads to inflated backtest performance.
Look-Ahead Bias: Using information not available at the time of trade leads to unrealistic results.
Robust strategy development now mandates walk-forward testing, Monte Carlo simulations, and realistic assumptions on order execution. The growing field of machine learning in finance has heightened these risks, as complex models are more prone to fitting noise rather than signal (Bailey et al., 2014).
9. Conclusion
Technical analysis occupies a contested but persistent role in finance. The empirical evidence is mixed but suggests that technical strategies can be profitable under certain market conditions and when costs are minimized. Institutional investors have increasingly integrated TA within quantitative and hybrid frameworks, reflecting its conditional usefulness.
While TA does not provide a universal arbitrage opportunity, it can serve as a valuable tool when applied adaptively, with sound risk management and rigorous testing. Its success ultimately depends on context, execution discipline, and integration within a broader investment philosophy.
References
Bailey, D. H., Borwein, J. M., Lopez de Prado, M., & Zhu, Q. J. (2014). "The Probability of Backtest Overfitting." *Journal of Computational Finance*, 20(4), 39–69.
Baltas, N., & Kosowski, R. (2020). "Trend-Following, Risk-Parity and the Influence of Correlations." *Journal of Financial Economics*, 138(2), 349–368.
Barberis, N., & Thaler, R. (2003). "A Survey of Behavioral Finance." *Handbook of the Economics of Finance*, 1, 1053–1128.
Brock, W., Lakonishok, J., & LeBaron, B. (1992). "Simple Technical Trading Rules and the Stochastic Properties of Stock Returns." Journal of Finance, 47(5), 1731–1764.
Chan, L. K. C., Jegadeesh, N., & Lakonishok, J. (1996). "Momentum Strategies." Journal of Finance, 51(5), 1681–1713.
De Prado, M. L. (2018). Advances in Financial Machine Learning, Wiley.
Fama, E. F. (1970). "Efficient Capital Markets: A Review of Theory and Empirical Work." Journal of Finance, 25(2), 383–417.
Gencay, R. (1998). "The Predictability of Security Returns with Simple Technical Trading Rules." Journal of Empirical Finance, 5(4), 347–359.
Han, Y., Yang, K., & Zhou, G. (2021). "Technical Analysis in the Era of Big Data." *Review of Financial Studies*, 34(9), 4354–4397.
Jegadeesh, N., & Titman, S. (1993). "Returns to Buying Winners and Selling Losers: Implications for Stock Market Efficiency." *Journal of Finance*, 48(1), 65–91.
Lo, A. W. (2004). "The Adaptive Markets Hypothesis: Market Efficiency from an Evolutionary Perspective." *Journal of Portfolio Management*, 30(5), 15–29.
Moskowitz, T. J., Ooi, Y. H., & Pedersen, L. H. (2012). "Time Series Momentum." *Journal of Financial Economics*, 104(2), 228–250.
Neely, C. J., Weller, P. A., & Ulrich, J. M. (2009). "The Adaptive Markets Hypothesis: Evidence from the Foreign Exchange Market." *Journal of Financial and Quantitative Analysis*, 44(2), 467–488.
Neely, C. J., Rapach, D. E., Tu, J., & Zhou, G. (2014). "Forecasting the Equity Risk Premium: The Role of Technical Indicators." *Management Science*, 60(7), 1772–1791.
Park, C. H., & Irwin, S. H. (2007). "What Do We Know About the Profitability of Technical Analysis?" *Journal of Economic Surveys*, 21(4), 786–826.
Rouwenhorst, K. G. (1998). "International Momentum Strategies." *Journal of Finance*, 53(1), 267–284.
Zhu, Y., & Zhou, G. (2009). "Technical Analysis: An Asset Allocation Perspective on the Use of Moving Averages." *Journal of Financial Economics*, 92(3), 519–544.
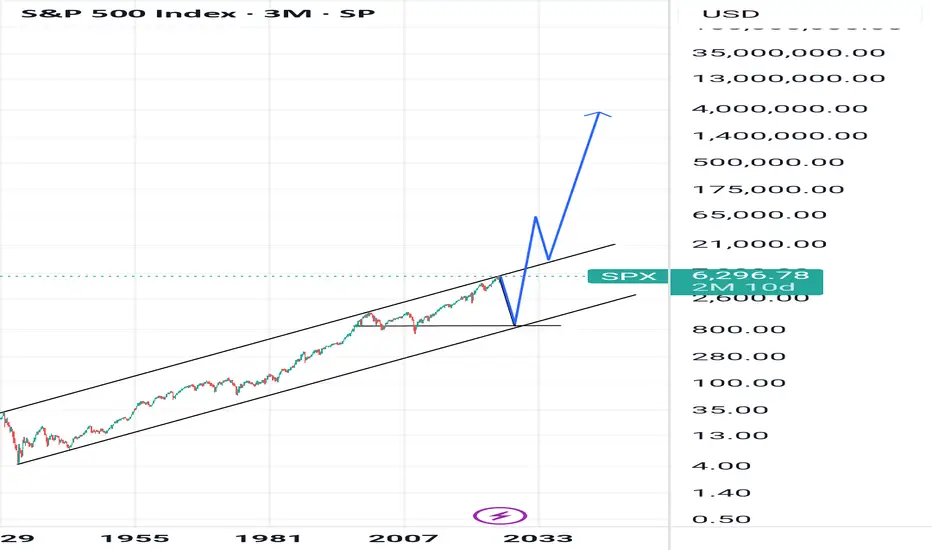
SPX More upside potentialI've revised my previous count based on recent price action. I now see a potential minor Wave 4 (of Intermediate Wave 5) forming around the 6,500 level. This could present a reasonable opportunity to take some % profits, (for the cautious or short term traders) though I recommend being prepared to re-enter, as I still believe we are ultimately headed toward the 6,650–6,720 range before a larger-scale correction sets in.
Taking some profits around 6,500 may be a prudent move, or alternatively, you can continue holding while adjusting your trailing stops accordingly.
Generally and in most cases its best to exhaust you bullish counts in Elliot .
On the right hand side i am showing SPX/ DXY which is typically a more accurate and discernable wave pattern then the SPX alone. FYI

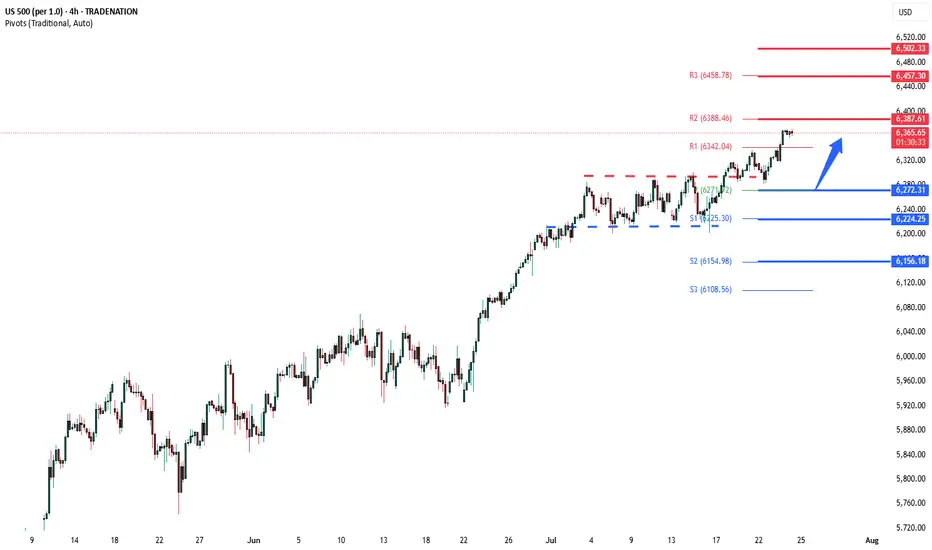
S&P500 push to new ATH? Key Developments:
AI Drives Earnings Momentum
Alphabet reported strong results, but flagged surging AI infrastructure costs, signaling increased capex ahead.
SK Hynix posted record earnings and committed to expanding AI-related investments, reinforcing the sector’s critical growth role.
Investor sentiment remains AI-positive, with capital rotation favoring tech and semiconductors despite margin compression risks.
Banking Sector Boosted by Tariff-Driven Volatility
Deutsche Bank’s FIC (Fixed Income & Currencies) trading revenue jumped 11% to €2.28B, its best Q2 since 2007, aided by global trade uncertainty.
BNP Paribas also beat earnings estimates, continuing the strong showing from European banks amid market volatility.
Trade & Tariff Watch
The EU and US are nearing a deal on a 15% standard tariff rate, potentially stabilizing trade flows and market pricing.
Trump’s broader reciprocal tariff push remains in focus, especially after the US-Japan deal. Investors are watching for signs of escalation or resolution with other partners like the EU and Canada.
Fed in the Political Spotlight
Trump visited the Fed’s construction site, criticizing costs and maintaining pressure on Chair Jerome Powell.
Speculation about Fed leadership changes and political interference is unsettling, though markets have largely shrugged this off for now.
Meanwhile, House Republicans are drafting a follow-up tax-and-spending plan, which could shape future fiscal policy and market expectations.
Conclusion: S&P 500 Trading Outlook
The S&P 500 remains buoyed by strong earnings, particularly from AI-linked sectors and financials, while geopolitical risks and tariff volatility are being absorbed as catalysts for trading profits rather than panic.
Bullish factors: Strong corporate earnings (Alphabet, SK Hynix, Deutsche Bank), potential trade de-escalation (EU-US tariff deal), and AI momentum.
Risks to monitor: Rising AI capex (impact on margins), political tension around the Fed, and tariff uncertainty.
Key Support and Resistance Levels
Resistance Level 1: 6387
Resistance Level 2: 6457
Resistance Level 3: 6502
Support Level 1: 6272
Support Level 2: 6224
Support Level 3: 6156
This communication is for informational purposes only and should not be viewed as any form of recommendation as to a particular course of action or as investment advice. It is not intended as an offer or solicitation for the purchase or sale of any financial instrument or as an official confirmation of any transaction. Opinions, estimates and assumptions expressed herein are made as of the date of this communication and are subject to change without notice. This communication has been prepared based upon information, including market prices, data and other information, believed to be reliable; however, Trade Nation does not warrant its completeness or accuracy. All market prices and market data contained in or attached to this communication are indicative and subject to change without notice.
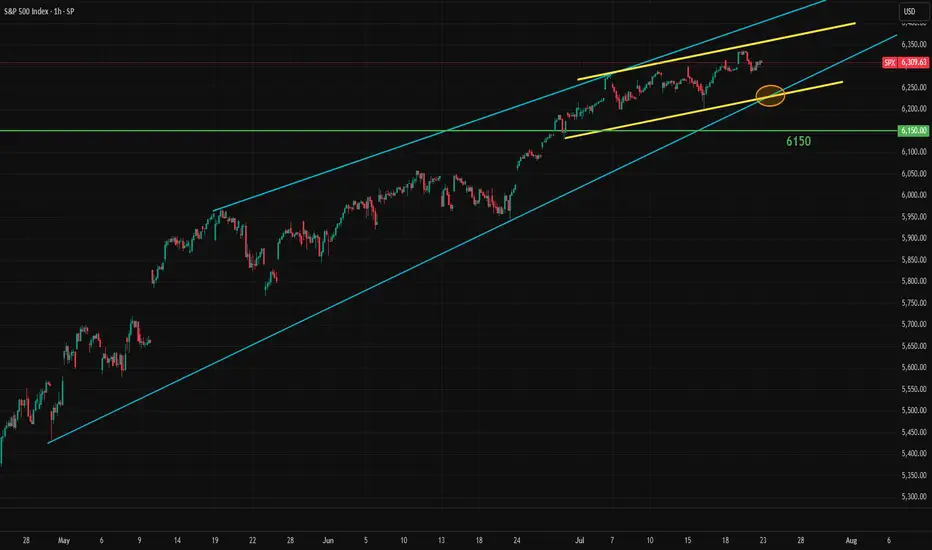
Market Breadth Flashes Warning, but S&P 500 Still Holds SteadyThe S&P 500 continues its slightly positive movement. However, the momentum has been slowing, forming a long, wedge-like pattern. These long wedges have been a recurring feature in the stock market for years. From the monthly timeframe to the 1-hour chart, the market often forms wedges.
Wedge formations tend to break to the downside but can persist for a long time before doing so. The S&P 500 typically makes a sharp correction selloff, then recovers in a "V" shape, followed by the formation of another wedge. This pattern appears to be repeating once again. Still, there are some negative signals that traders should be aware of:
1- The impact of tariffs on growth remains a major unknown. Most tariff deals have not been finalized yet. While the Japan agreement is a positive step, negotiations with the EU will be more significant.
2- Many earnings reports will be released in the coming weeks, potentially shaping market sentiment. These earnings will reflect some of the tariff effects. AI and tech remain the key market drivers, so their results will be especially important.
3- Some breadth indicators are showing early warning signs. One of the most useful is the "percentage of stocks above the 200-day moving average." This metric shows whether the market is broadly participating in the rally or being driven by a few large-cap names. Typically, when the market weakens, traders rotate into mega caps. The rounded numbers below shows the weakness:
March 2024 Top: 5250 - Percantege Above 200 MA: 85%
July 2024 Top: 5675 - Percantege Above 200 MA: 80%
December 2024 Top: 6100 - Percantege Above 200 MA: 74%
July 2025 Current: 6309 - Percantege Above 200 MA: 66%
This shows that fewer and fewer stocks are managing to stay above their 200-day moving average while S&P making new highs. This is not an immediate red flag, but the weakening is apparent.
In summary, the slightly positive outlook remains intact for now and is expected to continue until the wedge breaks with some early warning signs. If that happens, a sharp selloff may follow, creating both selling and buying opportunities. In the short term, 6280 is the immediate support level to watch.
S&P500 (CASH500) SHORT - head and shoulders 30minRisk/reward = 4.1
Entry price = 6378
Stop loss price = 6385.9
Take profit level 1 (50%) = 6349.2
Take profit level 2 (50%) = 6337.2
Still waiting on confirmation of a few variables at close of this 30min candle at 17.00

BuyRejection Level
Daily Volume
Market Structure Shift
London US Session
Trend Line Break
Untapped Order Point
SellRejection Level
Daily Volume
Market Structure Shift
London Session
Trend Line Break
Untapped Order Point

More upside for SPX500USDHi traders,
Last week SPX500USD made a small correction down (grey wave 4) and after it swept the dotted trendline it went up again. This could be the next impulse wave 5 (grey).
If this is true, then next week we could see more upside for this pair.
Let's see what the market does and react.
Trade idea: Wait for a small pullback and a change in orderflow to bullish on a lower timeframe to trade longs.
If you want to learn more about trading FVG's & liquidity sweeps with Wave analysis, then please make sure to follow me.
This shared post is only my point of view on what could be the next move in this pair based on my technical analysis.
Don't be emotional, just trade your plan!
Eduwave

SPX 0DTE TRADE IDEA – JULY 25, 2025
⚠️ SPX 0DTE TRADE IDEA – JULY 25, 2025 ⚠️
🔻 Bearish Bias with Weak Volume – Max Pain Looming at 6325
⸻
📊 Quick Market Snapshot:
• 💥 Price below VWAP
• 🧊 Weak Volume
• 📉 Max Pain @ 6325 = downside pressure
• ⚖️ Mixed Options Flow = no clear bullish conviction
⸻
🤖 Model Breakdown:
• Grok/xAI: ❌ No trade – weak momentum
• Claude/Anthropic: ✅ Bearish lean, favors PUTS near highs
• Gemini: 🟡 Slightly bullish bias, BUT agrees on caution
• Llama: ⚪ Neutral → No action
• DeepSeek: ❌ Bearish → No trade
⸻
📌 TRADE IDEA:
🎯 SPX 6365 PUT (0DTE)
💵 Entry Price: $0.90
🎯 Profit Target: $1.80 (💥 2x return)
🛑 Stop Loss: $0.45
📆 Expires: Today
🕒 Exit by: 3:45 PM
📈 Confidence: 65%
⏰ Entry Timing: OPEN
⸻
⚠️ Risk Flags:
• Low volume = fragile conviction
• Possible reversal if SPX breaks above session highs
• Max pain magnet at 6325 could limit gains or induce a bounce
⸻
🧠 Strategy:
Scalp it quick. Get in early. Exit before the gamma games explode into close.
📈 Like this setup? Drop a 🔽 if you’re playing puts today!
#SPX #0DTE #PutOptions #OptionsTrading #MaxPain #SPY #MarketGamma #TradingSetup

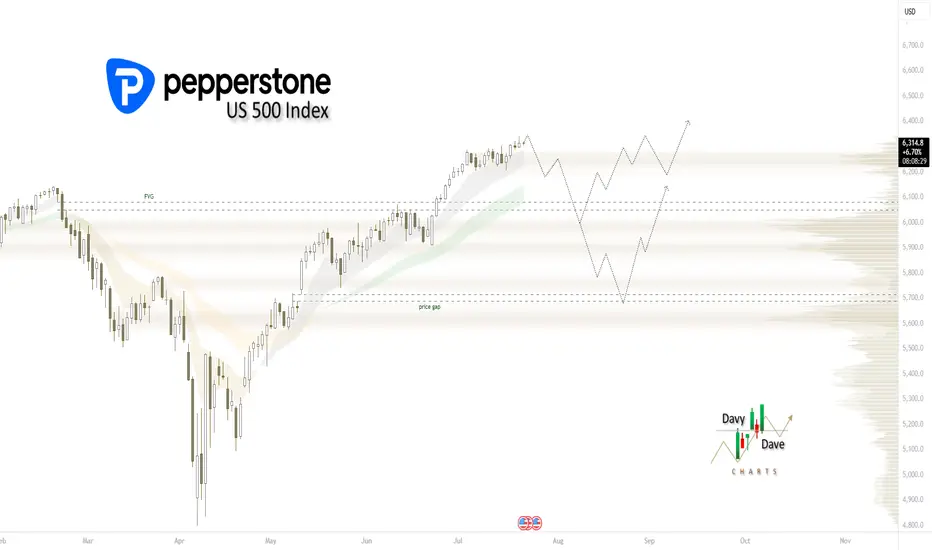
If we want a 2020-2021 style run, we need a seasonal pullbackUS 500 Index SP:SPX AMEX:SPY AMEX:VOO August seasonal scenario: institutional participation remains light, being outperformed by leveraged dip buying retail. How long can they remain on the sidelines, missing opportunities for their clients, before FOMO kicks in? Remember that institutions aren't emotionally driven, unlike their retail counter parts. That being said, they're itching to get in. What will compel them? IMO, a 5% pull back will incentivize them to buy. The August seasonal pull back may provide just that opportunity. If it comes, what happens in late Q3 and the rest of Q4 will likely be similar to 2020-2021. The deeper the pull back, the more impulsive it will likely be, as retail and institutions will be temporarily in tandem. SP:SPX PEPPERSTONE:US500 AMEX:SPY AMEX:VOO
Things are about to get wild. Just for fun... Hey, it can happen... right? 🤔😉
85% drop then.. hyper inflation.
S&P 500 Index Wave Analysis – 25 July 2025
- S&P 500 Index broke key resistance level 6300.00
- Likely to rise to resistance level 6500.00
S&P 500 Index recently broke the key resistance level 6300.00 (which stopped the previous waves 5 and (B), as can be seen below).
The breakout of the resistance level 6300.00 continues the active intermediate impulse wave (5) from the middle of this month.
Given the strong daily uptrend, S&P 500 Index can be expected to rise to the next resistance level 6500.00 (coinciding with the daily up channel from May).

sp500 up to 6535sp500 with in my pov target to 6535 by a flag created maybe and with this super upside trend for these days

This is just my Elliott Wave Analysis not financial Advice. $SPThis is just my Elliott Wave Analysis not financial Advice. SP:SPX #SPX SP:SPX
SPX500: Calm Returns, But Bearish Pressure Lingers Below 6283SPX500 OVERVIEW
Markets Calm After Powell Drama
Markets steadied Thursday following Wall Street's volatile reaction to uncertainty over Fed Chair Powell’s future. While President Trump denied plans to fire Powell, he admitted discussing the idea with lawmakers and hinted he'd prefer a resignation. For now, earnings and data are back in focus.
Technical View:
SPX500 is consolidating between 6283 and 6223.
A 1H close above 6283 may trigger a bullish move toward 6341.
Remaining below 6283 keeps bearish momentum intact toward 6223, and a break below that could start a deeper downtrend.
Key Levels:
Support: 6243, 6223, 6195
Resistance: 6305, 6341

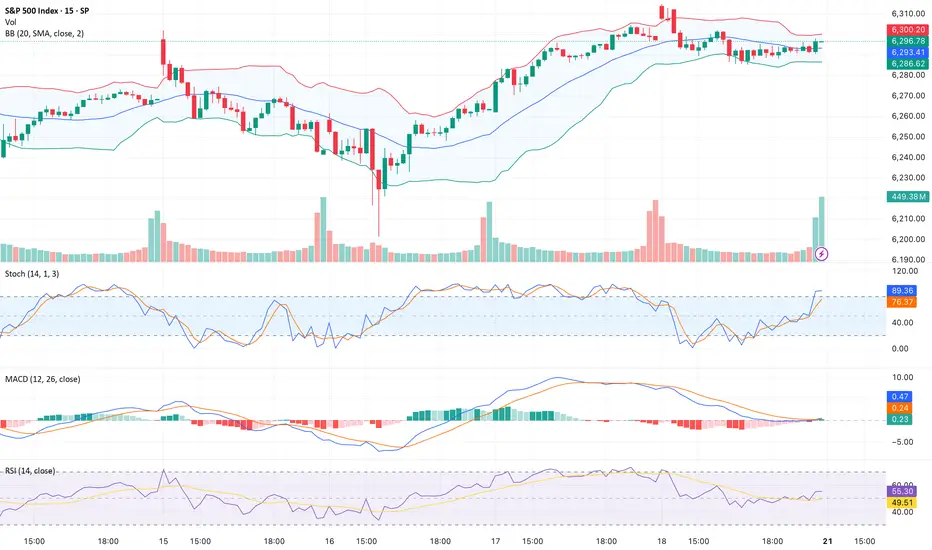
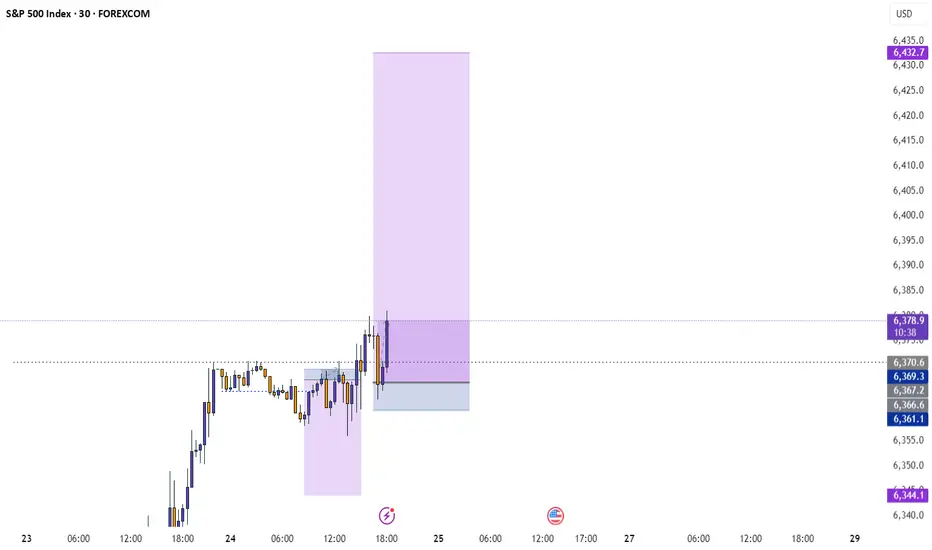
15_MinThis is a 15-minute timeframe chart, where each candlestick represents 15 minutes of trading activity. It is primarily used by intraday traders and scalpers to identify short-term trends, breakout zones, and momentum plays.
This chart of the S&P 500 (SPX) reflects intraday movements with real-time tracking of support/resistance zones, volume spikes, and short-term patterns.