S&P500 Chasing a Retrace - Waiting for Equilibrium After Rally🗓️ Yesterday, I mentioned watching the S&P 500 for a retrace to find a potential long entry. But with the US-China tariff agreement announced, the market rallied hard 🚀—a clear positive for stocks. We didn’t get much of a pullback, and right now, I see the S&P 500 as overextended. I’m not looking to jump in at these premium levels. Instead, I’m waiting for a Fibonacci retrace back down into equilibrium on the current swing for a better opportunity. 👀
My plan: I’ll watch for a bearish break of structure to signal a retrace, then monitor price action as we approach support. If support holds and we get a bullish break of structure, that’s when I’ll look to get involved. 🔄
Just sharing my idea here—this isn’t financial advice! 📢
SPX trade ideas

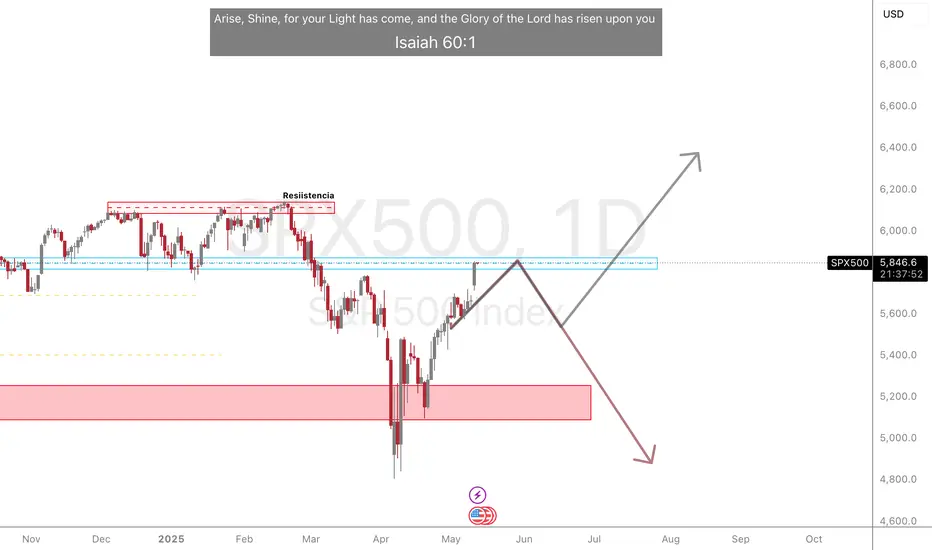
SPX500 Waiting for the movement...the blue area is the key to knowing exactly what position to take.
S&P 500 index Wave Analysis – 12 May 2025
- S&P 500 index broke resistance area
- Likely to rise to resistance level 5930.00
S&P 500 index recently broke the resistance area between the resistance levels 5800.00 (top of wave 4 from March), 5700.00 (which stopped wave 1 at the start of May) and the 61.8% Fibonacci correction of the downward impulse from February.
The breakout of this resistance area is aligned with the short-term impulse wave 3 of the intermediate impulse wave (3) from April.
S&P 500 index can be expected to rise to the next resistance level 5930.00, former support from January and February.

We Have a Full Pattern into The Target BoxI am now looking for a 5-wave pattern to develop to the downside, followed by a 3-wave retrace, that in the coming weeks can take us back out of the Target box to the downside. Price must breach the 5578 area to give us any indication the pattern to the upside below is cracking.

S&P 500 – an ascending channel on Daily Daily Chart (D1) :
I'm observing an ascending channel, with a potential manipulation near its lower boundary.
If that happens, we may see the formation of a bullish pivot point.
Hourly Chart (H1) :
I've marked the boundaries of the daily channel on H1.
There’s an unfilled gap below, and price might revisit that area.
I’m watching the 5690.7 level closely — it could act as a key zone for potential long setups.
📈 If 5690.7 holds , possible long targets include:
🎯 A break above the local high at 5848
🎯 The upper boundary of the channel, which closely aligns with the anticipated bullish pivot point target
📉 If price fails to hold above 5690.7 and breaks lower,
I’ll start considering short scenarios and will update this idea accordingly.

Continuation of bullish trendSeems that the trade deal between China and USA is behaving well with the general market, in my opinion the market will continue up for a while, however we need to be aware that at some point will need to breath and at least pull back to one of the EMAs, plus since it is now touching the top of the BB it will most likely pull-back at some point in the future, that doesn't mean it will reverse, but instead, give us another opportunity to enter the markets again, in line with the general market and at a good position to capitalize from the market movement.

SPX did the thing....How did we miss this? This is using price at market close data - but it basically did the whole cycle since the 2022 bottom up until now...
This stuff is always fascinating to me to see.

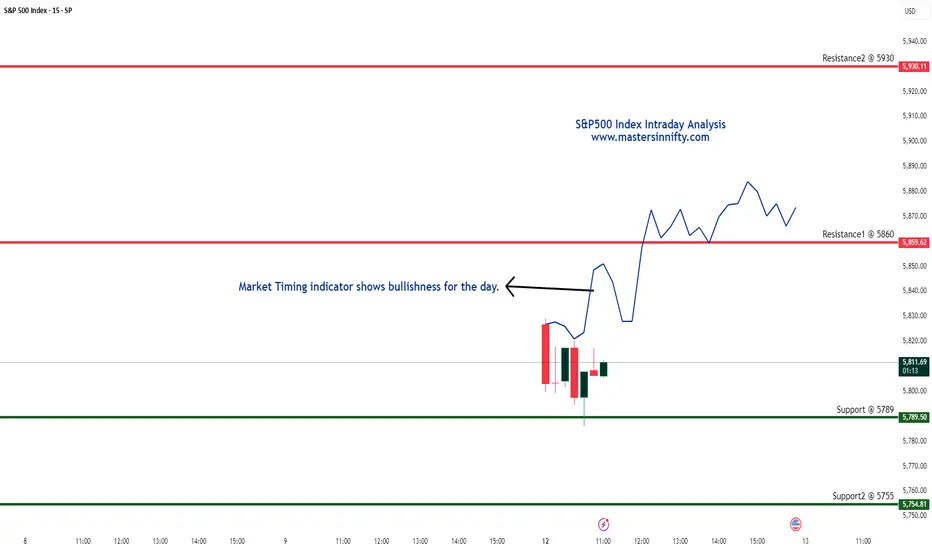
S&P500 Index Intraday Trend Analysis for May 12, 2025The S&P 500 Index is displaying bullish indications for the day. Key support levels are observed at 5789 and 5755, while resistance is expected around 5860 and 5930.
Please note, this is solely my personal view. Traders are advised to conduct their own technical analysis and ensure proper risk management before making any trading decisions.
SPX – Triple Breakout: Inverse H&S + EMA 200 + Ichimoku CloudSPX has confirmed a powerful bullish breakout with three confluences:
1. Inverse Head & Shoulders breakout
2. 200 EMA breakout
3. Ichimoku Cloud breakout
This alignment of structure, trend, and momentum indicators suggests a potential continuation move toward 6150 in the coming weeks.
Trade View:
Entry: On breakout retest or continuation
Target: 6150
Stop Loss: Below neckline or EMA200 depending on risk tolerance
Bias: Strongly bullish

SPX: US-China tariffs talkOne of the most important weekly events was the FOMC meeting, where its members held the interest rates unchanged for one more time. Many analysts are in agreement that the Fed made the right decision, without jumping-into-conclusion regarding the potential negative effects of trade tariffs. However, this topic was addressed by the Fed Chair Powell, at his after-the-meeting address to the public, where he noted a confidence that the Fed will react immediately in case that stronger negative effects of trade tariffs reflect in the economy. Here, he noted once again the dual mandate of the Fed - to keep full unemployment and inflation at the targeted 2%. The market reacted positively to his speech, bringing the US equity markets to the higher levels. The S&P 500 gained during the week, from 5.586 to 5.713. However, Friday's trading session was with a negative sentiment, considering forthcoming US-China tariffs talk, expected to start soon.
At the same time, the US managed to settle trade tariffs at the level of 10% with the United Kingdom. Analysts are commenting that this might be a general level for the majority of other countries. However, the US President published on social networks that he hopes to settle tariffs with China at 80%, which is still too high. Considering forthcoming talks between two governments and also taking into account that China is one of the most important trading partners with the US, the market sensitivity will continue to be in an on-off mode. This means that the market volatility will most certainly continue in the coming period.

Bollinger Band Target 5870Now that we've reset the RSI on all the mid time frames, the chance of getting to the BB after open is high. For bears, this may be a day of capitulation. We are over all the important MA's but the rest of the week has to hold above them for it to remain bullish.

05/05 SPX Weekly Playbook - GEX Zone Outlook🔮 What-If Scenarios for This Week – Based on GEX Structure until Firday
Last week’s market momentum pushed the S&P 500 up by almost 3%, effectively erasing the price gap left behind on Liberation Day. The index also strung together nine straight days of gains—something we haven’t seen since late 2004.
Meanwhile, implied volatility dropped significantly, with the VIX touching its lowest level since the holiday, falling to around 22.5.
Several factors seem to have fueled this bullish tone, including a more measured approach from Trump on trade policies and strong quarterly results from major tech names like Microsoft and Meta.
Still, the nature of the buying raises questions—was this a thoughtful rotation, or just a broad sweep of optimism?
~~~~~~~~~~~~~~~~~~~~~~~~~~~~~~~~~~~~~~~~~~
🔄 Chop Zone: 5650 – 5670 (wide transition zone)
🔹 Gamma Flip: 5615
🔺 Key Call Wall: 5725 (5800 potential shift)
🔻 Key Put Wall: 5500 (5400 major support below)
🔼 Upside Path
IF > 5670 → transition cleared →
➡️ 5700 stall / reaction
IF > 5725 → call wall breached →
➡️ Path to 5750 / 5775 → stall at 5800 (largest net call OI)
IF > 5800 → gamma resistance breaks down →
➡️ 5825/5850 zone opens up
🔽 Downside Path
IF < 5615 → gamma flip triggered →
➡️ 5500 = battle zone (massive put wall + high negative GEX)
IF < 5500 → negative gamma squeeze likely →
➡️ Stall zone: 5450 → flush to 5400
IF < 5400 → high-volatility regime →
➡️ Possible acceleration to 5375 / 5340 depending on IV spike
⚖️ Neutral Setup
IF 5650–5670 holds → dealer hedging = balanced →
➡️ Ideal for non-directional spreads / theta plays
➡️ Wait for breakout confirmation above 5670 or below 5615
~~~~~~~~~~~~~~~~~~~~~~~~~~~~~~~~~~~~~~~~
🔍 Final Thoughts
We’ve seen a sharp rally since the Trump trade war scare, with barely any meaningful pullback. The market appears to be looking for one—as a breath. Based on current GEX positioning, there’s significantly more downside hedging than upside, especially in the mid-term May expirations.
That doesn’t necessarily mean we crash—but it does mean that moves lower can accelerate faster, while upward breakouts may require more energy or time. In this environment, consider:
Bearish or neutral spreads (put debit spreads, call credit spreads)
Volatility-based strategies
Avoiding naked upside trades unless we see a strong reclaim of 5725+
Stay safe and adapt—GEX doesn’t tell direction, but it does tell where the fire might start, beacuse of reflexting to hedging activity.

S&P500 Analysis 12-May-25 Disclaimer: easyMarkets Account on TradingView allows you to combine easyMarkets industry leading conditions, regulated trading and tight fixed spreads with TradingView's powerful social network for traders, advanced charting and analytics. Access no slippage on limit orders, tight fixed spreads, negative balance protection, no hidden fees or commission, and seamless integration.
Any opinions, news, research, analyses, prices, other information, or links to third-party sites contained on this website are provided on an "as-is" basis, are intended only to be informative, is not an advice nor a recommendation, nor research, or a record of our trading prices, or an offer of, or solicitation for a transaction in any financial instrument and thus should not be treated as such. The information provided does not involve any specific investment objectives, financial situation and needs of any specific person who may receive it. Please be aware, that past performance is not a reliable indicator of future performance and/or results. Past Performance or Forward-looking scenarios based upon the reasonable beliefs of the third-party provider are not a guarantee of future performance. Actual results may differ materially from those anticipated in forward-looking or past performance statements. easyMarkets makes no representation or warranty and assumes no liability as to the accuracy or completeness of the information provided, nor any loss arising from any investment based on a recommendation, forecast or any information supplied by any third-party.

Overnight Futures Pop 2.8% on Surprise Tariff TruceYou either woke up to a panic… or to a profit.
This morning, markets are ripping higher - not because of earnings, not because of data - but because two superpowers shook hands over fondue in Switzerland.
If you're feeling blindsided, you probably chased last week’s noise.
If you're feeling calm, you’re probably following the AntiVestor way.
---
SPX Market Briefing
The headlines are loud. So let’s talk facts.
Over the weekend, the United States and China agreed to a 90-day tariff rollback:
US duties drop from 145% to 30%
China drops theirs from 125% to 10%
Both sides now pretending to like each other until mid-August
Markets reacted the only way they know how: with euphoria.
SPX futures are up 2.8%. Nasdaq is flying. The Dow surged more than 900 points premarket.
Here’s what we did:
Nothing reckless. Nothing oversized. Nothing emotional.
The system turned bearish late last week, and we followed it - small, tactical, mechanical. Not a bet. Just a position.
And here’s the kicker:
I still held a few bullish positions from the prior bias. They were so far out-of-the-money, I didn’t even bother closing them.
Guess what?
They’re in profit - and my net exposure is green despite the initial bear swing going underwater.
So while the news makes others overreact, we get to do what we always do:
Let the market come to us.
The real money isn’t made chasing this 2.8% pop.
It’s made waiting for the next confirmed setup.
...and a little good luck always helps ;)
---
Expert Insights:
Mistake: Jumping into emotional gap openings
AntiVestor Fix: Let others panic. Let your system speak.
Gap moves on news tend to retrace or fade - and even if they don't, entering late is a coin toss. Smart traders wait. Pros wait. We wait.
---
Rumour Has It…
Whispers from the Swiss hotel bar claim the entire US-China agreement was sparked when both delegates reached for the same dessert spoon. One espresso and a bottle of Pinot later, tariffs were slashed and SPX gapped 2.8%.
This is entirely made-up satire. Probably!
Breaking scoops courtesy of the Financial Nuts Newswire-because who needs sanity?
Fun Fact
According to CBOE data, Monday gap-ups following geopolitical “resolutions” average a +2.2% open… but only hold those gains 41% of the time by Friday’s close. Which means chasing the open? Not your best trade. Waiting for follow-through? That’s the edge.

S&P 500 WEEKLY Bullish Divergence According to this bullish divergence we have on weekly time frame for S&P 500, it can push to about $6800 and Bitcoin follows to new ATHs

US500: Weekly Bias Bearish I am waiting for a manipulation on this Monthly FVG for a bearish move.
let me know what you think.

The final rally or the beginning of hyper-inflation? This is an ascending wedge, (65% chance of a break to the downside statistically,) that the S&P500 has been trading in for it's entire life cycle. All historical data points to a final topping process as market makers head back for the top trend to liquidate short positions that took positions on the last plunge.
The former sell-off showed no signs of big money taking full exit from the market as it was quite gradual; allowing short positions to stack at back tests of key resistance areas. Therefore, it stands to reason that the oversold daily RSI was going to allow for a powerful bounce to catch shorts off guard. The market will not sell off largely until shorts have capitulated as exchanges and banks load up for a final rally to completely remove those positions and sell new highs. when this happens, there will be no gradual dump but, instead, a red waterfall with news about hyperbolic, impending disasters coming out after the largest institutions push the sell button.
Breaking that top trend on the 3 month logarithmic chart would be a first in market history and denote hyper-inflation followed by the coming crash being even more violent then anyone believes is possible. It is a good time to start scaling out of the market little by little.

SPX500 Bull Flag SetupSPX500: Broke the dump trendline—watch for a partial retest. Sitting inside a Bull Flag, we may see a fakeout lower before continuation.

SPX500 SLOWS DOWN AT BEARISH ORDER BLOCK!With SPX500 index slowing down at the bearish order block, the next trading week most likely will be bearish...
N.B!
- SPX500 price might not follow the drawn lines . Actual price movements may likely differ from the forecast.
- Let emotions and sentiments work for you
- ALWAYS Use Proper Risk Management In Your Trades
#spx
#spx500
#es

US500 bearish 12 May - 16 May 2025S&P 500 Bearish Outlook: Targeting $5,100 Amid Rising Uncertainty
As of May 12, 2025, the S&P 500 (US500) stands at 5,661, reflecting a robust recovery from its April lows. However, I anticipate a bearish shift, projecting a decline towards the $5,100 level in the near term. Several converging factors underpin this outlook:
1. Anticipated Weakness in Core CPI Data
The upcoming release of the April Core Consumer Price Index (CPI) on May 13 is poised to be a pivotal event. While the year-over-year Core CPI is forecasted at 2.8%, matching the previous month's figure, the month-over-month increase is expected to rise to 0.3%, up from 0.1% in March. This acceleration suggests persistent inflationary pressures, potentially prompting the Federal Reserve to maintain or even tighten monetary policy, thereby exerting downward pressure on equities.
2. Deteriorating Market Sentiment and Forecasts
A notable shift in market sentiment is evident, with key indicators turning bearish. A prominent S&P 500 model has signaled its first bearish outlook since February 2022, reflecting growing investor apprehension. Additionally, leading financial institutions have revised their S&P 500 targets downward:
Goldman Sachs: Reduced from 6,500 to 5,700
RBC Capital Markets: Lowered from 6,600 to 5,500
Oppenheimer: Cut from 7,100 to 5,950
Yardeni Research: Adjusted from 7,000 to 6,000
These revisions underscore the mounting concerns over economic headwinds and market volatility.
3. Sectoral Divergence: Opportunities Amidst the Downturn
While the broader market faces challenges, certain sectors may exhibit resilience or even bullish tendencies:
Healthcare: Continues to serve as a defensive sector, with companies demonstrating solid quarterly results and reaffirming full-year guidance despite tariff impacts.
Energy Infrastructure: Firms like Enbridge and TC Energy benefit from long-term structural tailwinds, including rising energy demand and global energy security priorities.
Financials and Technology: Sectors represented by ETFs such as XLK and XLF are highlighted for their strong fundamentals and growth prospects.
Conversely, consumer discretionary sectors are showing signs of strain, with negative revenue surprises and companies like Harley-Davidson withdrawing their 2025 outlooks amid tariff uncertainties.
4. Implications of the US-UK Trade Deal
Recent developments in the US-UK trade agreement further contribute to market uncertainty. While the deal includes exemptions for certain British goods, such as aerospace components and a quota of 100,000 UK-made cars annually, it also maintains a baseline 10% tariff on foreign goods. This policy introduces complexity and potential cost pressures for multinational companies operating across borders.
Moreover, the agreement has faced criticism for being one-sided, with concerns that it may not adequately protect domestic industries or address broader trade imbalances. Such apprehensions can dampen investor confidence and contribute to market volatility.
The convergence of persistent inflation, cautious monetary policy, revised market forecasts, and the complexities introduced by recent trade agreements suggest a bearish trajectory for the S&P 500, with a potential decline towards $5,100. Investors should remain vigilant, monitoring sector-specific developments and macroeconomic indicators to navigate the evolving market landscape.
Disclaimer: This analysis is for informational purposes only and does not constitute investment advice. Always conduct your own research before making investment decisions.

$SPX Urgent! My <3 & My Soul: Slow Bleed Crash to 3k by Q4 26' Do be warned. Very important post here. I put my heart and soul into this. I made a video earlier and then it got deleted by accident, so I made a less happy one right after. I've got news for all the bulls and investors out there that feel they will be able to continue buying every single dip out there. Get ready for the dip that keeps dipping. Big names already cracking heavy. NASDAQ:META NASDAQ:TSLA NASDAQ:AMD NASDAQ:NVDA to name a few. Big tech is getting cleaned out and layoffs are on the rise. Tariffs create huge amounts of uncertainty. I don't feel like this is rocket science. Buffet is all cash. 89% of Hedge Fund managers believe the US market is the most expensive its ever been and Tutes have been selling at the highest rate ever before. I think it's time the US finally gets a shake down. Bullish conditioning has been running rampant, and I've seen Social Media Accounts discourage charting and only paying attention to price action? Price action involves the entire collective, not just one Timeframe. Anyways, here's an overlay from 01' ... the only one I could find that matches. Says short 560 around May 7th and then take profits around 500 again. Let's make this a nice one. Calls till 560 into May then flip to Puts into June. From then short 530 every time you can. $450 is My first target after we break previous lows. I will update as we go. Have a good one yall.

$SPX / $SPY - Decision point reached at resistanceWhilst SP:SPX is looking healthier above its MAs, it printed a swing failure pattern (SFP) on the daily into the prior support (now resistance zone) which aligns with a swing symmetry from the news swing in early April. Price is sitting on the 61.8 fib, and is also rejecting the 100 EMA.
If shorts want to take charge, this is the place to do it.

S&P Trade Plan for 12/05/2025Dear Traders,
The index continues its upward trend toward the 6000 area, and after a correction from this level, it will be ready to launch a strong bullish move.
If you enjoyed this forecast, please show your support with a like and comment. Your feedback is what drives me to keep creating valuable content."
Regards,
Alireza
