SPX: Buy ideaBuy idea on SPX as you can see on the chart because we have a good intersection between resistance line and the support line.
SPX trade ideas

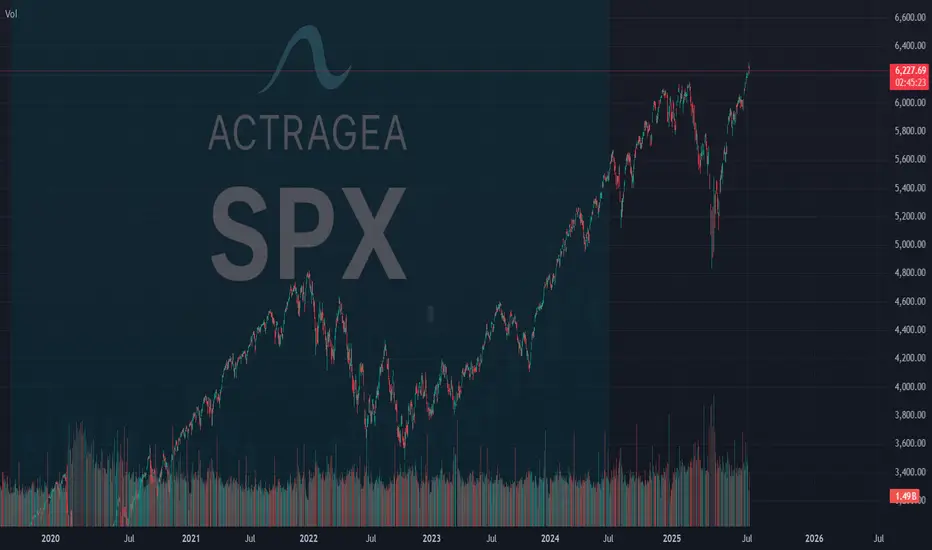
S&P500 Bullish continuation developing close to ATHUS Secretary of State Marco Rubio is meeting Russian Foreign Minister Lavrov today at an ASEAN summit, as tensions remain high over the war in Ukraine. President Trump has criticized Putin and pledged more weapons for Ukraine. Meanwhile, Ukrainian allies are meeting in Rome to plan postwar rebuilding.
Trump also announced new tariff plans—50% on Brazil and 20% on the Philippines, though further talks are expected. He said a temporary ceasefire between Israel and Hamas could be close, possibly within weeks.
In business news, X CEO Linda Yaccarino is stepping down, Meta faces a competition warning in France, and Wall Street banks are preparing financing for a $4.25 billion Boots buyout. Nvidia became the first company ever to hit a $4 trillion market value, boosted by strong investor demand.
US Equity Outlook:
Markets may trade mixed. Nvidia’s historic surge could lift tech stocks, but geopolitical tensions and trade uncertainty may limit gains. Investors will watch for more updates on tariffs and global talks.
Key Support and Resistance Levels
Resistance Level 1: 6290
Resistance Level 2: 6340
Resistance Level 3: 6400
Support Level 1: 6180
Support Level 2: 6120
Support Level 3: 6070
This communication is for informational purposes only and should not be viewed as any form of recommendation as to a particular course of action or as investment advice. It is not intended as an offer or solicitation for the purchase or sale of any financial instrument or as an official confirmation of any transaction. Opinions, estimates and assumptions expressed herein are made as of the date of this communication and are subject to change without notice. This communication has been prepared based upon information, including market prices, data and other information, believed to be reliable; however, Trade Nation does not warrant its completeness or accuracy. All market prices and market data contained in or attached to this communication are indicative and subject to change without notice.

$SPX Tomorrow’s Trading Range and everything in it /// 7.10.25Today’s Trading range and everything in it. How are you playing it?


SPX500 Eyes New ATH – Key Levels in PlaySPX500 – Overview
The index remains under bullish pressure, with potential to record a new all-time high (ATH).
As long as the price holds above 6246, the bullish trend is likely to continue toward 6282.
A confirmed 1H close above 6287 could trigger further upside toward 6310 and 6341.
However, a break below 6223 would signal bearish momentum, opening the path toward 6195 and 6143.
Pivot Line: 6282
Resistance: 6310, 6341
Support: 6246, 6223, 6195

SPX500 RallyThe SPX500 price will drastically grow in the coming days. Price has broken out a bullish flag pattern. We may anticipate and enter on the retest around 6230

Sp500S&P 500 (SPX) Technical Update:
Closing Price: 5648.39 (as of last week’s close)
Outlook: The SPX appears poised for a potential rally, with immediate resistance levels identified at 5700.00, 5800.00, and 6000.00. Based on current technical indicators and market conditions, a continuation of the bullish trend to the 5800.00 level within the next month seems plausible.
Technical Indicators Supporting a Bullish Move:
Moving Averages: The SPX is currently trading above its 50-day and 200-day moving averages, indicating a strong bullish trend. The positive crossover between these moving averages often signals sustained upward momentum.
Relative Strength Index (RSI): The RSI is currently positioned in the bullish zone (above 50) and has not yet reached overbought conditions. This suggests that there is room for further upside before any potential reversal.
MACD (Moving Average Convergence Divergence): The MACD line is above the signal line, and the histogram is in positive territory. This indicates that the momentum is favorable and supports the possibility of further gains.
Volume: Recent upward movements have been accompanied by increasing trading volume, which validates the strength of the rally and suggests that buying interest remains robust.
Summary: Given the strong technical indicators and the current market environment, the SPX is well-positioned to advance towards the 5800.00 level over the next month. Current buying opportunities appear favorable for potentially significant gains.

SPX500SPX500: Bullish Momentum Builds – 6500 in Sight?
📍 Current Price: 5977.00
📈 Bias: Strongly Bullish
🎯 Target: 6500+
📉 Invalidation Level: 5850 (Short-term support)
📊 Technical Outlook:
The SPX500 continues to show strong bullish momentum as it trades at all-time highs near 5977.00. With persistent buying pressure and supportive macro tailwinds, the index looks poised for further upside.
Key observations:
✅ Price Action: Clean breakout and consolidation above recent highs. No signs of exhaustion yet.
📈 Trend: Clearly up across all major timeframes (Daily, 4H, 1H).
🧠 Psychological Level: 6000 is within reach, and a break above could open the path toward 6500 as the next major round number and Fibonacci extension level.
💡 Market Sentiment: Risk-on tone prevails; tech and mega caps continue to lead.
🔍 Support & Resistance Levels:
Resistance: 6000 → 6150 → 6500
Support: 5900 → 5850 → 5735
⚠️ Risk Management:
While the setup remains bullish, traders should watch for:
Surprise macro headlines (Fed speeches, inflation data, geopolitical risks)
Pullbacks toward support for potential re-entries
📝 Conclusion:
SPX500 remains in a powerful uptrend. As long as price holds above key short-term support at 5850, bulls retain full control. A breakout above 6000 could trigger a fresh wave of institutional buying, driving price toward 6500 in the coming weeks.
📢 Let me know your thoughts — are we heading for 6500 next?
👍 Like & follow for more real-time market insights!

Hmm...Since I started in crypto, I've seen this play out dozens of times. If it's your first time, I suggest looking at Bitcoin or Ethereum to get a rough idea of what this cycle looks like and how to recognize it.
I'm waiting for a blow off top, but I could just as easily be left in the dust. Time will tell, and my precious metals will keep me warm at night lol

X1: SPX500/US500 Short Trade Risking 1% to make 1.35%FOREXCOM:SPX500 / CAPITALCOM:US500 Short for week, with my back testing of this strategy, it hits multiple possible take profits, manage your position accordingly.
Risking 1% to make 1.35%
Note: Manage your risk yourself, its risky trade, see how much your can risk yourself on this trade.
TP-1 is high probability TP but don't overload your risk like greedy, be disciplined trader.
Use proper risk management
Looks like good trade.
Lets monitor.
Use proper risk management.
Disclaimer: only idea, not advice

S&P 500 Technical Analysis – Potential Correction AheadThe S&P 500 is approaching critical historical resistance levels, just as economic headwinds begin to resurface — particularly the expiration of tariff ceasefire agreements and renewed trade tensions. These overlapping factors could signal an upcoming technical correction.
🔹 From a technical standpoint:
The index is forming a classic multiple-top pattern, typically associated with weakening bullish momentum and potential trend reversals.
However, we remain cautious and will only consider a bearish scenario if the 6200 support level is broken on a daily close.
📉 Proposed Trading Plan:
• Short entry: Only if the daily close is below 6200
• Stop-loss: Daily close above the last top
• Targets in order:
• 5800
• 5500
• 5250
⚠️ Note: Despite the bearish setup, we do not recommend rushing into selling without confirmation of support break.

SPX - This IS the TOPA three day test of the high is as obscure as it can get, especially when I hear on tv that there is near certainty that every dip is a buying opportunity. We have enough for the move to count as a wave 5. The next move down should be a doozy. I'd be happy with a few down days with the intense resiliancy of stocks. Too much money in the system. Can prices go to infinity?

SPX500 Awaits Breakout as Trade Talks Fuel Market CautionWall Street Edges Up Amid Tariff Talks & Trade Turbulence
U.S. stock index inched higher on Wednesday as markets remain on edge over President Donald Trump's aggressive tariff stance and the ongoing negotiations with global trade partners. Traders are cautiously watching for clarity, with sentiment shifting quickly on any updates.
📉 SPX500 Technical Outlook
The index continues to consolidate within a narrow range between 6223 and 6246. A confirmed breakout from this zone is needed to define the next directional move.
A break below 6223 would confirm bearish continuation toward 6194, with potential extension to 6143.
A break above 6246 would shift the bias bullish, targeting 6282, followed by 6305.
Key Levels:
Support: 6223 / 6195 / 6143
Resistance: 6282 / 6305

Trading at the market topHello,
The stock market is back at an all-time high. This often brings excitement for existing investors—and a sense of anxiety or even FOMO (fear of missing out) for those who stayed on the sidelines when prices were lower.
It’s tempting to jump in, especially with headlines filled with optimism and portfolios showing green across the board. But this is also a time for caution and patience.
After a sustained rally, price levels often outpace fundamentals like earnings growth, economic stability, or interest rate trends. In such moments, valuations can become stretched, and investor sentiment overly euphoric conditions that typically precede short-term pullbacks or corrections.
Buying at the top locks in risk, not value.
If you're feeling late to the party, remember that good investors don’t chase prices—they wait for prices to come to them.
The best opportunities often come in moments of fear, not euphoria. And while this market high may go higher still, history shows that eventually, corrections come—and those prepared for them are the ones who win in the end.
Disclosure: I am part of Trade Nation's Influencer program and receive a monthly fee for using their TradingView charts in my analysis.

SPX - short here to test pivot around 6,040hit key area on the backtest heading back down to 6k area

S&P 500 H1 | Falling toward an overlap supportThe S&P 500 (SPX500) is falling towards an overlap support and could potentially bounce off this level to climb higher.
Buy entry is at 6,186.42 which is an overlap support that aligns with the 23.6% Fibonacci retracement.
Stop loss is at 6,130.00 which is a level that lies underneath a swing-low support and the 38.2% Fibonacci retracement.
Take profit is at 6,268.39 which is a swing-high resistance.
High Risk Investment Warning
Trading Forex/CFDs on margin carries a high level of risk and may not be suitable for all investors. Leverage can work against you.
Stratos Markets Limited (tradu.com ):
CFDs are complex instruments and come with a high risk of losing money rapidly due to leverage. 63% of retail investor accounts lose money when trading CFDs with this provider. You should consider whether you understand how CFDs work and whether you can afford to take the high risk of losing your money.
Stratos Europe Ltd (tradu.com ):
CFDs are complex instruments and come with a high risk of losing money rapidly due to leverage. 63% of retail investor accounts lose money when trading CFDs with this provider. You should consider whether you understand how CFDs work and whether you can afford to take the high risk of losing your money.
Stratos Global LLC (tradu.com ):
Losses can exceed deposits.
Please be advised that the information presented on TradingView is provided to Tradu (‘Company’, ‘we’) by a third-party provider (‘TFA Global Pte Ltd’). Please be reminded that you are solely responsible for the trading decisions on your account. There is a very high degree of risk involved in trading. Any information and/or content is intended entirely for research, educational and informational purposes only and does not constitute investment or consultation advice or investment strategy. The information is not tailored to the investment needs of any specific person and therefore does not involve a consideration of any of the investment objectives, financial situation or needs of any viewer that may receive it. Kindly also note that past performance is not a reliable indicator of future results. Actual results may differ materially from those anticipated in forward-looking or past performance statements. We assume no liability as to the accuracy or completeness of any of the information and/or content provided herein and the Company cannot be held responsible for any omission, mistake nor for any loss or damage including without limitation to any loss of profit which may arise from reliance on any information supplied by TFA Global Pte Ltd.
The speaker(s) is neither an employee, agent nor representative of Tradu and is therefore acting independently. The opinions given are their own, constitute general market commentary, and do not constitute the opinion or advice of Tradu or any form of personal or investment advice. Tradu neither endorses nor guarantees offerings of third-party speakers, nor is Tradu responsible for the content, veracity or opinions of third-party speakers, presenters or participants.

Why Traders Freeze: The Psychology Behind Not Cutting LossesFirst up: let’s address the elephant in the room. Loss aversion — that great human flaw. From the moment your ancient ancestor decided to poke a saber-toothed tiger to see what happens, the brain has been hard-coded to avoid pain at all costs.
Loss aversion is literally in your DNA — studies show people feel the sting of a loss twice as intensely as the pleasure of an equivalent gain.
When you see that trade slip into the red, your rational brain may say, “Cut it, the setup is invalid, live to trade another day.” But your emotional brain — the one still grunting in a cave — is screaming, “It might come back! Hold! HOOOLD!” So you sit, frozen.
🌱 Hope: The Most Expensive Four-Letter Word
Hope is the silent killer of trading accounts. You think you’re being patient as you decide to give the trade “room to breathe.”
But what you’re really doing is outsourcing your exit strategy to technical tools, news headlines, and anything that’s not your own choice, hoping something will rescue your losing position.
This is how tiny losses can turn into portfolio ruin. Just ask anyone who’s held a small-cap memecoin down 90% because the “team has potential.”
🧊 Analysis Paralysis: When the Chart Becomes a Maze
Another reason traders freeze? Overanalysis. One bad candle and suddenly you’re toggling between the 1-minute, 5-minute, and daily chart like you’re hacking into the Pentagon. And your trendlines? You’re probably drawing them wrong .
More data rarely leads to more decisive action. It just feeds your brain conflicting signals until you’re convinced you see a bounce that isn’t there. Meanwhile, the loss grows. And grows. And then you’re back to hope. Rinse, repeat.
😬 The Ego Monster: Admitting You’re Wrong
Here’s the harsh truth: cutting a loss means admitting you were wrong. For traders, whose entire identity can hinge on being “smart money,” that feels like public humiliation. The ego monster wants you to be right more than it wants you to be profitable.
So instead of taking the small L, you’ll cling to the trade because closing it out would force you to look in the mirror and say, “I was wrong and I need to do better.”
🏴☠️ From Risk Management to Revenge Trading
Once you’ve frozen long enough, you reach the next stage of the bad-losing cycle: revenge trading . Now you’re not just trying to recover your loss; you’re out to punish the market for “taking” your money.
Spoiler alert: the market doesn’t know you exist, and it certainly doesn’t care. Maybe this is the gambler’s mindset disguised as a “strategy?”
📉 Blame the Tools? Not So Fast
Some traders love to blame outside factors like the Economic calendar or their indicators when they freeze. “My RSI didn’t signal this! The MACD betrayed me!” Indicators are just tools — they don’t make decisions for you. You do.
Hiding behind tools means you refuse to take accountability. It’s a convenient excuse that can keep you stuck in the same losing habits. Better to master the one tool that matters: your discipline .
✂️ The Beauty of the Hard Stop
All hail the hard stop — the trader’s seatbelt. It’s not attractive, it’s mechanical, but it’s often the only thing standing between you and a potentially blown-up account.
The reason some traders can survive the market for decades isn’t because they’re never wrong — it’s because they’ve learned to make their stops non-negotiable.
A stop-loss is you telling your brain, “Hey, I’m not smarter than the market, so I’ll automate the decision before I get emotional.” It takes the agony out of cutting a loss because you’ve already decided on the outcome before your lizard brain can intervene.
⚖️ Small Losses Are the Cost of Doing Business
Want to feel better about cutting that loss? Think of it as your tuition fee. Every trader pays a certain cost to the market — it’s the cost of playing the game. No one gets every trade right. The pros just get better at losing small.
Those big-shot money spinners you look up to? They didn’t build their empire by never losing. They’re pros at getting out when they’re wrong. The difference between a pro and a blow-up isn’t the winning trade — it’s the ruthless discipline on the losing ones.
🧘♂️ Finding Comfort in Discomfort
There’s no magic trick to make loss-cutting feel good. It always stings. But you can train your brain to see a small loss as a win for your long-term survival. Write it down. Journal the trade . Log the emotion. Over time you’ll realize that the trades you exit early rarely haunt you.
🏁 Face the Fear, Keep the Account
And finally, freezing in front of a loss doesn’t protect you — it likely means you’ll pay more than you should. Next time your gut says, “Maybe it’ll come back…” ask yourself: “Do I want to be right, or do I want to trade another day?”
Your job is to trade well and stay in the game for as long as possible.
Your turn, traders : what’s your biggest “should’ve cut it sooner” horror story? Drop it below — we promise not to say we told you so.

BuyHigher Time Frame Reject Level
Bullish Previous Week
Market Structure Shift Bullish
Asian Session
Trade
Manage
Smile

SPX - Are you catching the rotation trends? SPX is still holding very bullish price action. Technicals are pointing towards higher price and todays inside consolidation day certainly helps digest recent gains.
Along with the flat indices market session, we did observe some massive capital rotation trends.
Financials saw a pretty strong down move across the board. JPM / BAC / C all saw large outflows. We were positioned on the short side of financials and took profits on JPM puts.
Even with the big selloff in financials, SPX held up surprisingly well.
Capital simply rotated instead of outright leaving the market. Bullish Signal.
Technology, Energy, Materials, Health care, Transports all saw capital inflow trends.
Rotation into under preforming sectors is a sign that markets could be staging another healthy leg up.
We still have an upside target over 6300 on SPX.

Bearish drop?S&P500 is reacting off the resistance level which is a pullback resistance and could drop from this level too ur take profit.
Entry: 6,237.85
Why we like it:
There is a pullback resistance level.
Stop loss: 6,268.46
Why we like it:
There is a pullback resistance level.
Take profit: 6,187.51
Why we like it:
There is a pullback support that is slightly below the 61.8% Fibonacci retracement.
Enjoying your TradingView experience? Review us!
Please be advised that the information presented on TradingView is provided to Vantage (‘Vantage Global Limited’, ‘we’) by a third-party provider (‘Everest Fortune Group’). Please be reminded that you are solely responsible for the trading decisions on your account. There is a very high degree of risk involved in trading. Any information and/or content is intended entirely for research, educational and informational purposes only and does not constitute investment or consultation advice or investment strategy. The information is not tailored to the investment needs of any specific person and therefore does not involve a consideration of any of the investment objectives, financial situation or needs of any viewer that may receive it. Kindly also note that past performance is not a reliable indicator of future results. Actual results may differ materially from those anticipated in forward-looking or past performance statements. We assume no liability as to the accuracy or completeness of any of the information and/or content provided herein and the Company cannot be held responsible for any omission, mistake nor for any loss or damage including without limitation to any loss of profit which may arise from reliance on any information supplied by Everest Fortune Group.

SPX: 75% chance Multi-Timeframe Reversal to 5,775-6,103 Zone **SPX MULTI-TIMEFRAME CYCLE CONFLUENCE ANALYSIS - SUPER VERSION**
**CURRENT SITUATION: July 7, 2025 - Price: 6,238**
Based on our quantitative cycle analysis across 4 timeframes, applying **ACTRAGEA hierarchical dominance principles** where ITM >> MTY >> TCY >> TYL.
---
## **CYCLE HIERARCHY STATUS**
| **Timeframe** | **Cycle Phase** | **Status** | **Hierarchy** | **Key Level** |
|---------------|-----------------|------------|---------------|---------------|
| **ITM (1D)** | Phase 2 | FLAT | **DOMINANT** | Max: 6,284.65 **awaiting confirmation** |
| **TCY (1H)** | Phase 2 | FLAT | Secondary | Max: 6,284.65 **awaiting confirmation** |
| **MTY (270m)** | Phase 1 | LONG (+1.64%) | Subordinate | Seeking max: 6,359 |
| **TYL (15m)** | Phase 2 | LONG (+0.11%) | Subordinate | Max: 6,242.7 **awaiting confirmation** |
---
## **PRIMARY SCENARIO (Probability: 75%)**
**DIRECTIONAL BIAS:** **Multi-timeframe reversal upon ITM maximum confirmation**
**RATIONALE:**
- **ITM timing**: 0 bars remaining from 50° percentile window → Maximum at 6,284.65 **awaiting confirmation** → Statistical pressure for confirmation increases daily
- **Hierarchical cascade**: **When ITM confirms maximum** → all subordinate cycles transition into Phase 3 (minimum search)
- **Current LONG positions** (MTY +1.64%, TYL +0.11%) face hierarchical override risk upon ITM maximum confirmation. Subordinate cycles will align regardless of current profitability.
**STATISTICAL PRICE LEVELS (50° Percentile):**
- **ITM**: 5,775.84
- **TCY**: 6,103.58
- **MTY**: 5,996.35
- **TYL**: 6,170.98
**STATISTICAL TIME WINDOWS (50° Percentile):**
- **ITM**: 65 bars | **TCY**: 58 bars | **MTY**: 62 bars | **TYL**: 81 bars
**EXTREME SCENARIOS (20° Percentile):**
- **ITM**: 5,420.71 | **TCY**: 5,934.73 | **MTY**: 5,728.16 | **TYL**: 6,084.71
---
## **⚠️ ALTERNATIVE SCENARIO (Probability: 25%)**
**DIRECTIONAL BIAS:** ITM extension toward 80° percentile before maximum confirmation
**CONDITION:** ITM exceeds statistical time boundaries, allowing subordinate cycles temporary independence
---
## **CRITICAL DECISION POINT**
**Confirmation Trigger:** ITM maximum validation at 6,284.65 → Phase 2→3 transition → Activation timeframe: Within 1-3 trading sessions (statistical pressure)
**Hierarchy Activation:** Immediate subordinate cycle alignment into Phase 3 upon ITM confirmation
**Invalidation:** Sustained break above 6,285 (negates ITM maximum thesis)
---
## ** PROBABILITY FOUNDATION**
**75% probability derived from:**
- ITM expired timing creating high statistical pressure for confirmation
- Historical dominance patterns (85%+ subordination rate upon ITM phase changes)
- Dual Phase 2 alignment (ITM + TCY at identical maximum level awaiting confirmation)
---
## **ACTRAGEA METHODOLOGY FOUNDATION**
Our **quantitative cycle framework** operates on **hierarchical dominance principles** where longer timeframes command shorter ones. Statistical levels represent **50° percentile probabilities**, not certainties. The **ITM critical juncture** at 6,284.65 creates high-probability setup for **coordinated multi-timeframe reversal initiation**.
**Performance Context:** Systems demonstrating 65.71% to 82.86% statistical reliability across timeframes.
---
*Analysis based on ACTRAGEA hierarchical cycle principles and statistical percentile distributions. All levels represent probabilities, not guaranteed outcomes.*
Logarithmic channelsThe price has reached a support area at the bottom of the long-term logarithmic channel. If this area will not hold the price I see a possible spike to 5330 level which is 1.618 retracement of March 13 bottom - March 25 top. The price did the same retracement in October 2023. Pay attention that we have 1d positive divergence forming on RSI. We are bottoming, a crash is unlikely right now. The reversal will most likely happen this week.

S&P500 Strong Buy Signal flashed for the 3rd time in 2 years!The S&500 index (SPX) is comfortably trading above its previous All Time High (ATH) and shows no signs of stopping here. Coming off a 1D MA50/ 100 Bullish Cross, we expect the 1D MA50 (blue trend-line) to turn now into the first long-term Support going towards the end of the year.
The last 1D MA50/ 100 Bullish Cross (December 15 2023) was nothing but a bullish continuation signal, which extended the uptrend all the way to the 2.0 Fibonacci extension, before a pull-back test of the 1D MA100 (green trend-line) again.
The 1W RSI is now on the same level (63.30) it was then. In fact it is also on the same level it was on June 05 2023, which was another such bullish continuation signal that peaked on the 2.0 Fib ext.
This suggests that we have a rare long-term Buy Signal in our hands, only the 3rd time in 2 years that has emerged. Based on that, we should be expecting to see 7600 as the next Target before it hits the 2.0 Fib ext and pulls back to the 1D MA100 again and there is certainly enough time to do this by the end of the year, assuming the macroeconomic environment favors (trade deals, potential Fed Rate cuts etc).
-------------------------------------------------------------------------------
** Please LIKE 👍, FOLLOW ✅, SHARE 🙌 and COMMENT ✍ if you enjoy this idea! Also share your ideas and charts in the comments section below! This is best way to keep it relevant, support us, keep the content here free and allow the idea to reach as many people as possible. **
-------------------------------------------------------------------------------
Disclosure: I am part of Trade Nation's Influencer program and receive a monthly fee for using their TradingView charts in my analysis.
💸💸💸💸💸💸
👇 👇 👇 👇 👇 👇
