SUI new trend started!SUI / USDT
Price broke out after long accumulation range with good volume
Looks like a new bullish trend has started
SUIUSD trade ideas

Sui - next target Sui is following Eth as most alts do.
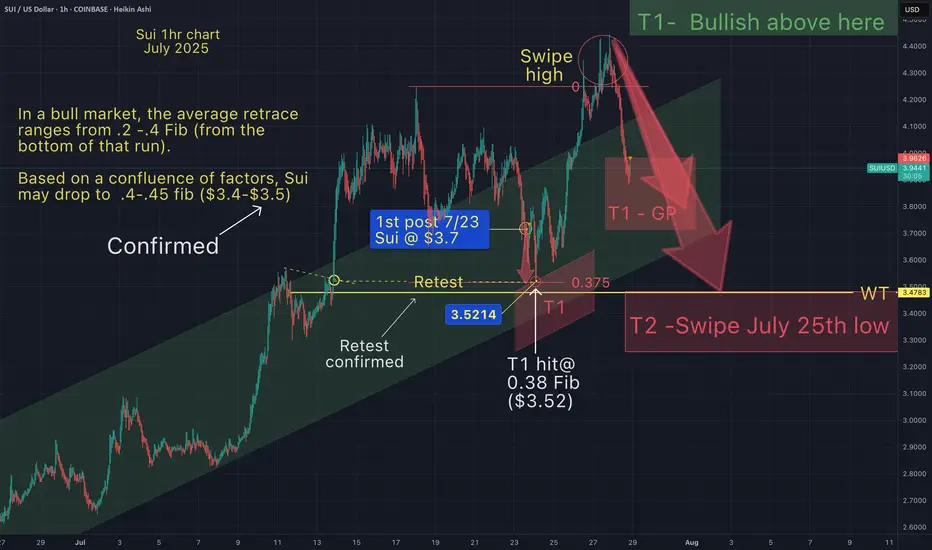
Just an update on July 23rds chart targets (seen from a different lense).

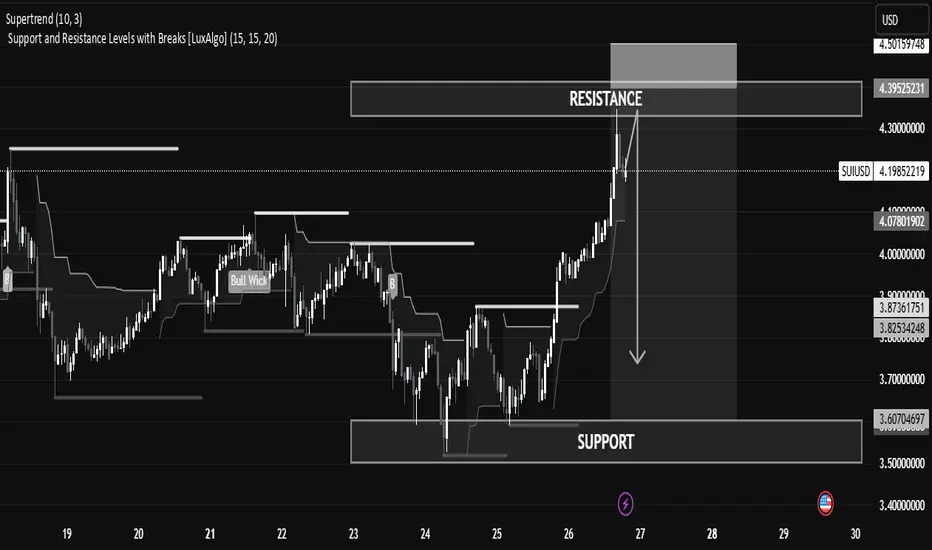
SUI/USD Technical Analysis – Potential Reversal Zone IdentifiedSUI/USD Technical Analysis – Potential Reversal Zone Identified
The current SUI/USD price action shows a strong bullish impulse reaching into a well-defined resistance zone, suggesting a potential pullback or reversal in the short term.
🔍 Key Levels
Resistance Zone: Between 4.30 – 4.39 USD, currently being tested after a strong bullish run. This is a historical supply area where price previously reversed.
Support Zone: Found between 3.60 – 3.70 USD, where price consolidated and accumulated before initiating the current rally.
Current Price: 4.2044 USD, slightly below the resistance zone, showing early signs of rejection.
📊 Technical Indicators & Structure
Supertrend (10,3): Bullish signal still active, suggesting trend strength, though traders should be cautious near resistance.
Break of Structure (BoS): Clean upward breaks suggest buyer dominance, but profit booking or sell-side liquidity may emerge near resistance.
Volume & Momentum: Impulse candles show strength, but volume tapering near resistance could indicate exhaustion.
📘 Educational Perspective
This setup highlights the importance of trading within key zones:
Buying at support, where demand is strong.
Monitoring resistance for signs of exhaustion or reversal patterns like wicks, doji, or bearish engulfing.
Risk Management Tip: In such cases, aggressive traders might short from resistance with tight stops, while conservative traders wait for confirmation (e.g., break and retest of the support or resistance).
Sui - Target 2 just hit (alternate view)I love it when a plan comes together.
I hope my T3 doesn't hit (after this next bounce).
May the trends be with you.
Sui - My T2 target just hit As anticipated, target 2 (T2) was hit right on time (as indicated by red arrow set a few days ago)
Sui dumped after taking the liquidity above the high and I
assumed it would swipe the lows as well...before any chance
of a meaningful move towards the upside.
I hope, Sui doesn't hit my bearish T3
The angle I chose for my arrow, is an average angle of attack.
I love it when a plan comes together.
May the trends be with you!

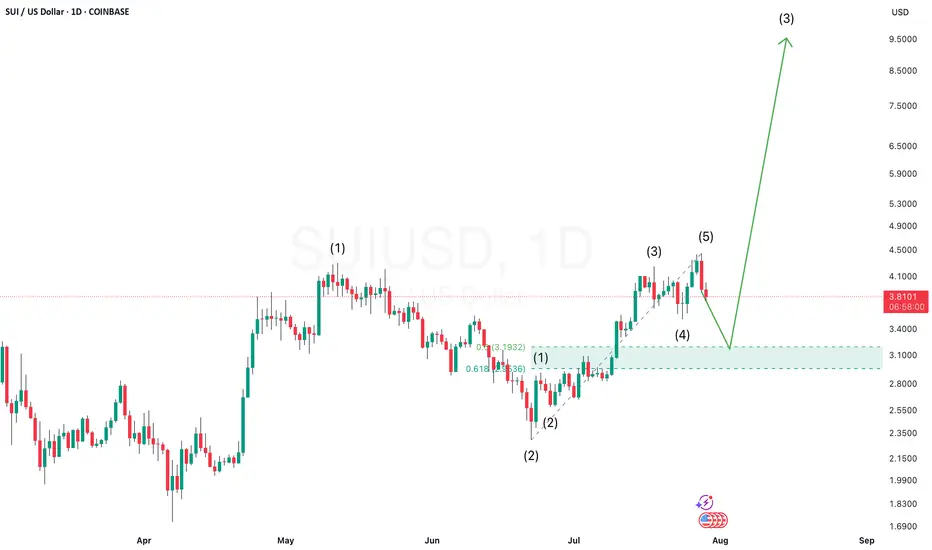
SUIUSD Setting Up for a Potential 1-2, 1-2 Pattern — Wave 3 BlasSUIUSD appears to be forming a classic 1-2, 1-2 Elliott Wave setup — a bullish structure that often precedes an explosive third wave rally.
In this pattern, we first see a motive Wave 1 followed by a corrective Wave 2, then another smaller-degree Wave 1 and 2 within the larger Wave 3. This kind of nested structure shows strong underlying bullish momentum building up in layers.
Once the second minor Wave 2 completes, SUI could launch into a powerful third wave of Wave 3, typically the strongest and most extended move in the sequence. That’s the breakout phase where price accelerates rapidly, often leaving late buyers behind.
Watch for confirmation
SUI — Structured Dip Buy Zone You Shouldn't IgnoreSUI has been technically clean, with well-respected Elliott Wave counts and fib levels.
As the broader market dips, it's time to look for sniper long entries and SUI is setting up beautifully for one around the $3.50 zone.
🧩 Key Confluence Zone: $3.50
This level offers a high-probability buy zone, backed by multiple layers of technical confluence:
0.786 Fib Retracement: $3.5029
1.0 Trend-Based Fib Extension: $3.5036
Previous Trading Range POC: $3.4675
Previous Weekly Open (pwOpen): $3.494
🟢 Long Trade Setup
Entry: ~$3.500
Stop-loss: $3.4675
Target (TP): $3.85+
R:R: ~1:3
🛠 Indicator Note
In this analysis I'm using my own indicator:
➡️ DriftLine — Pivot Open Zones
It helps identify key market opens (daily, weekly, prior), which often act as magnet levels and reaction zones.
➡️ You can use it for free — just check out my profile under “Scripts” and apply it to your charts.
💡 Pro Insight: Build Trades Where Tools Agree
A single level is just noise. But when fib retracements, extensions, POCs, opens, and price structure all line up — that’s where conviction trades are made.
The more overlap, the more likely the market reacts — this setup shows just that.
Final Thoughts
SUI is approaching a technically rich zone around $3.50, and this could be one of those low-risk, high-reward long entries if confirmed by price action.
With a clean invalidation and 1:3 R:R, this is the kind of setup you want to plan — not chase.
Set your alerts, stay patient, and trade with structure. 🚀✍️
_________________________________
💬 If you found this helpful, drop a like and comment!
Want breakdowns of other charts? Leave your requests below.
Sui next target (T2)As anticipated Sui would drop somewhere between the .2-.4 Fib (of the entire run).
As shown on the chart, Sui has hit the 3.8 Fib.
This was also expected because of the dotted yellow line indicating a breakout retest.
Also my price prediction on 7/23/25 was between $3.4 - $3.5.
So far Sui has hit my target within less than 1% @ $3.52.
Sui may bounce from here since it is in the golden pocket (red T1).
But I would not be surprised if Sui continues down to hit T2 (swipe recent low),
and liquidate the longs before starting its face melting pump upwards.
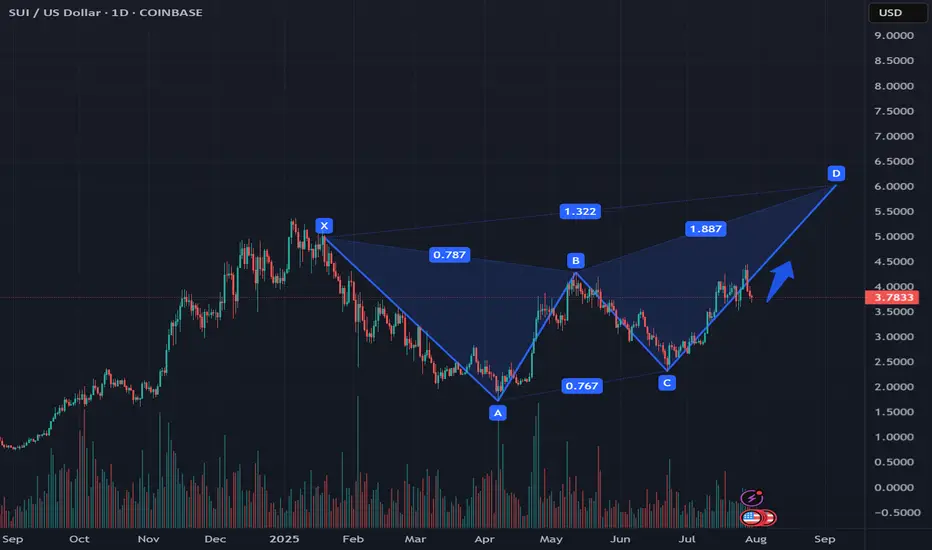
SUI Completes Butterfly Pattern: Possible Bullish Continuation According to the previous analysis, SUI successfully completed the butterfly pattern.
According to the pattern, an upward movement is expected to the nearest $3.95 zone and possibly $4.1
Also, according to the pattern, a rollback to the $3.3 zone is unlikely
This analysis is based on the technical pattern and also incorporates AI to provide more accurate results.
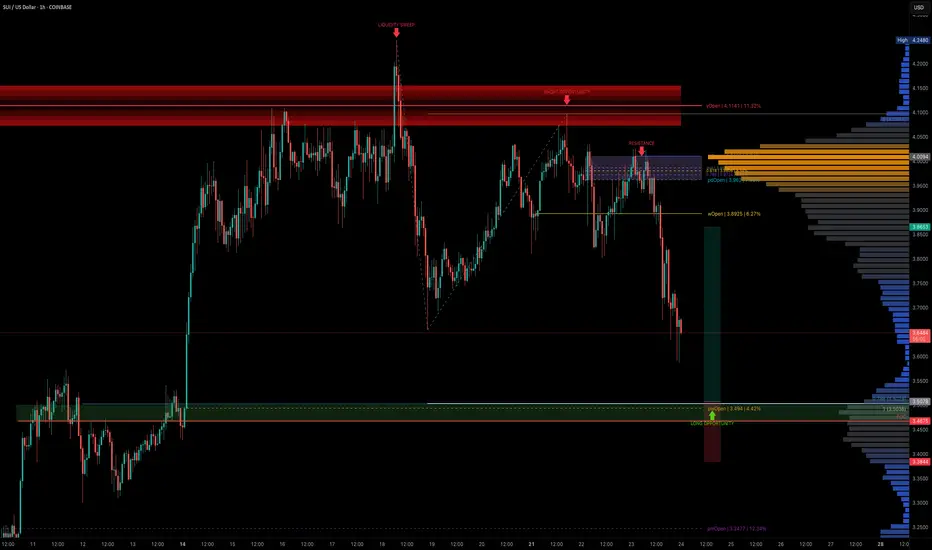
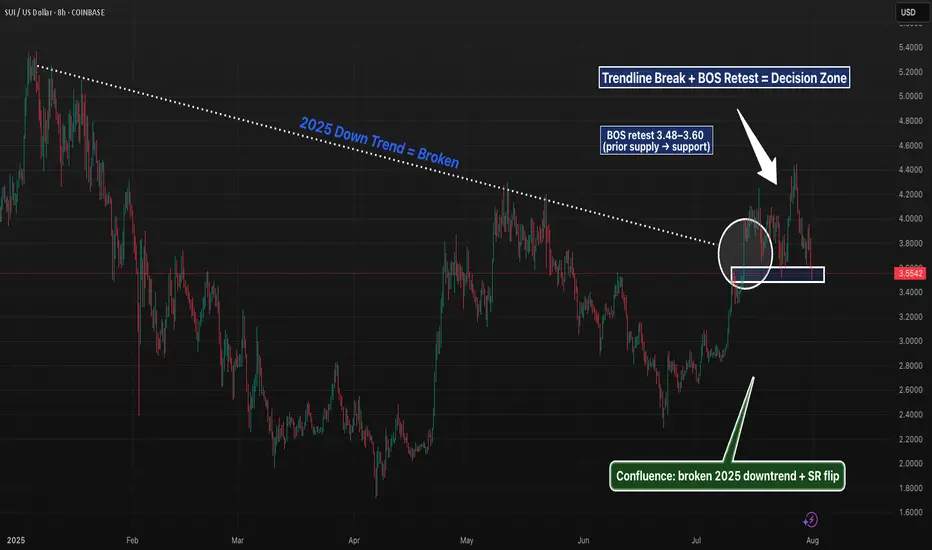
SUI 8H – Trendline Break, BOS Retest, and SR FlipSUI is at a pivotal level after cleanly breaking its 2025 downtrend and flipping prior supply into potential support. The current zone ($3.48–$3.60) marks a textbook BOS retest, aligning with the broken trendline and a clear structure shift.
Price has already printed a higher high, and if this zone holds, it could establish a higher low — a key confirmation for bullish continuation. Momentum traders may watch for reclaim of $3.70 for confluence, while invalidation sits below $3.32.
A break lower opens the door to deeper retracement targets around the 0.618 zone ($3.32–$3.38), but structure remains intact until then. Clean price action, strong confluence, and a clear invalidation level make this an actionable zone to watch.
📊 Structure: BOS → Retest
🧠 Bias: Bullish if $3.48–$3.60 holds
📉 Invalidation: 8H close below $3.32
🔔 Next key levels: $3.90, $4.10, $4.45
SUIUSD – Snapped Trend, Needs FuelSUI launched off $3.62 support, breaking trendline and 200 SMA around $3.81, reaching $3.95. RSI got hot (~63) and now turning. It’s pausing under resistance, forming a potential flag. $3.89 is key support to hold for next push. Below that risks retracing deeper.

SUI Forms W or Butterfly Pattern: Potential Downward Move ExpectOn the global SUI CRYPTOCAP:SUI chart, a W or butterfly pattern is emerging, according to both patterns, the movement is likely to go down
The market is also returning to previous prices, but the liquidity gap has not yet formed on the dollar dominance chart, most likely another strait in the price of altcoins is expected, perhaps deeper than yesterday
Current price $3.83
Possible price drop with these patterns up to $3.77 or $3.67 or even lower $3.3
There is also a risk that the market will go up to $4.091
This analysis is based on the technical pattern and also incorporates AI to provide more accurate results.
Sui targetsIn a bull market, the average retrace
ranges from .2 -.4 Fib (from the
bottom of that run).
Based on a confluence of factors, Sui may
drop to a minimum .4-.45 fib ($3.4-$3.5)

12R setup forming on SUITime to send it after that big channel retest? Clean 12R setup
Entry: 4.0
SL: 3.9
Target: 5.2

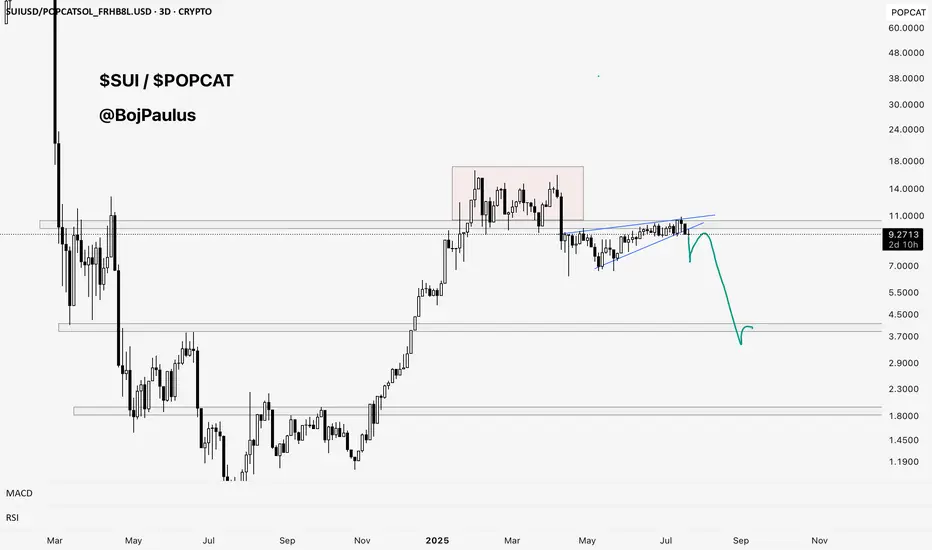
POPCAT is Cooking! Sui holders might want to look awayPOPCAT is cooking. SUI holders might want to look away. 🐱🍽️
A 2X outperformance is in the cards, potentially more.
SUIUSD – Fib Zone or Fade?SUI failed a breakout at $4.05, reversed hard, and now trades near the 0.618 fib zone ($3.88). Price dipped as low as $3.82 before stabilizing. RSI curling from oversold (~30), indicating early recovery attempt. Structure still bearish unless bulls reclaim $3.96–$4.00. Risky but bounceable.
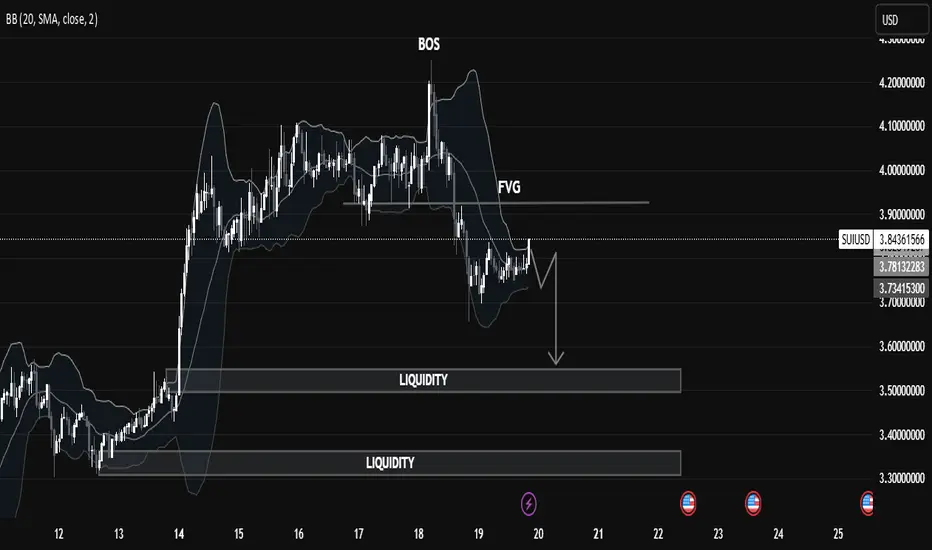
SUIUSD Liquidity Trap in Motion: Price Targeting Deeper Pools🧠 Market Structure Insight (SMC Framework)
🔍 1. Break of Structure (BOS):
The most recent BOS around the $3.95 level marked a bull trap, indicating a transition from bullish momentum to a distribution phase. This suggests institutional players offloaded liquidity at premium prices before initiating a markdown.
🕳️ 2. FVG (Fair Value Gap):
A visible Fair Value Gap (Imbalance) remains unmitigated above the current price action. This zone acted as a supply area, where price sharply moved down, leaving inefficiency in its trail—now serving as a potential point of rejection if revisited.
📌 Liquidity Zones:
Upper Liquidity Cleared: Price has swept highs before reversal (a sign of engineered liquidity grab).
Double Liquidity Pools Below:
First pool: Around $3.55 - $3.60
Second pool: Deep liquidity around $3.30 - $3.35
These levels are highly attractive for Smart Money to target next, suggesting continuation to the downside.
📉 Current Price Behavior:
Market is consolidating in a tight range just below FVG, signaling potential re-accumulation of sell orders.
The chart pattern suggests a potential lower high forming, likely to precede a bearish leg towards liquidity zones.
Bollinger Bands show compression, hinting at volatility expansion soon.
🎯 Trade Outlook (Not Financial Advice):
🔻 Bearish Bias:
Unless price breaks above the FVG zone with strong bullish momentum, the probability favors a bearish continuation targeting:
1st Target: ~$3.55
2nd Target (Deeper liquidity grab): ~$3.30
A rejection from FVG followed by a BOS to the downside would serve as confirmation for this bias.
📚 Educational Takeaway:
This chart is a clean illustration of Smart Money Concepts in play:
BOS > FVG > Liquidity Sweep
Price respects institutional footprints: grab liquidity, fill imbalances, then drive toward untouched liquidity zones.
Recognize market intent through structure shifts and imbalance reaction.
6:1 R:R trade setup for SUIAnother attempt at a 6:1 R:R setup with a target at the all-time high of 5.3.
Entry: 3.9417
Stop Loss: 3.745
Target: 5.3
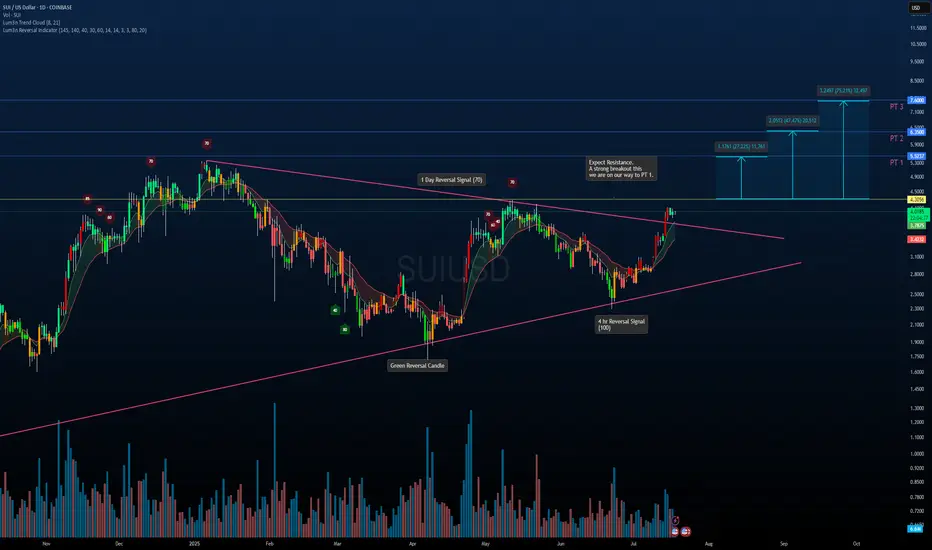
SUI/USDT – Symmetrical Triangle Breakout in PlaySUI has officially broken out of a multi-month symmetrical triangle on strong momentum. This structure has been building since early 2024 and now looks ready for continuation.
Key Notes:
Breakout confirmed above trendline resistance with strong volume.
Reversal signals on the 1D and 4H timeframes aligned before the move.
Pullback toward the breakout zone is possible before continuation.
Upside Fibonacci-Based Targets:
PT1: $5.32 (+27%)
PT2: $6.53 (+47%)
PT3: $7.60 (+75%)
If the breakout holds and momentum continues, these levels offer a solid roadmap for potential long-term gains. Watching how price reacts around the $4.30 resistance will be key.
Not Financial Advice – For educational purposes only.
SUIUSD – Calm Before ContinuationSUI made an explosive move from $3.25 to $4.20+ in two days. After peaking, it's consolidating in a tight bull flag around $4.00–$4.07. Momentum is cooling slightly, but the uptrend remains intact. Clear breakout trigger sits at $4.10+ for new highs.
SUI on its way to the teal pennants breakout targetSui has joined the bullishness here as it has brown up from the pennant and well on its way to the target. *not financial advice*

SUI - 4H Potential ReversalRight now the market is extremely hot as BTC is skyrocketing to the upside. However we are beginning to reach levels where a short term pullback could be on the table to flush out overleverage. Therefore, if a pullback does occur then these are the levels to watch.
For SUI we are seeing very early signs of a short term reversal occurring.
The first bearish signal was a 4H reversal doji followed by tweezer tops right at the psychological $4 level.
In addition to this we are seeing early signs of a bearish divergence forming. Higher high in price, lower low on our RSI. Showing that some strength of this rally might be fading.
If this reversal does occur then the $3.40-$3.60 level would be the first level to watch for bulls to hold. This could be a great level to long from in accordance to BTC maintain strength. Will also post the SUI daily chart that has confluence with this prediction as well.
However if BTC continue to reach for high and SUI reverses this bearish signal then $4.60 would be the next level followed by a test of its previous ATH.

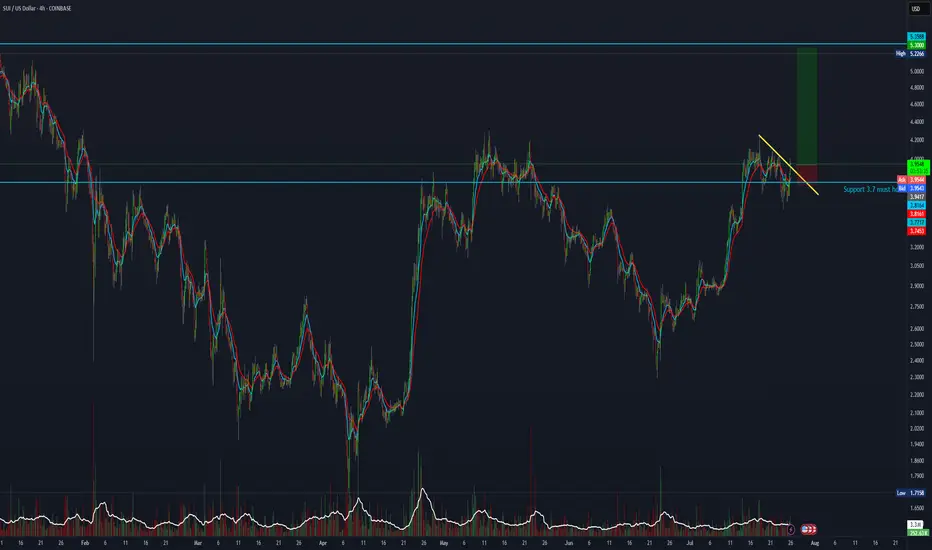
SUI Holding Breakout – Is the ATH Next?SUI is breaking above the 0.5 retracement level after a strong reversal from the golden pocket. With price now in a clean range toward all-time highs, continuation depends on whether bulls can defend the $3.45+ area.
Momentum is high, but Stoch RSI is overbought — stay alert for either a breakout push or short-term cooldown.
