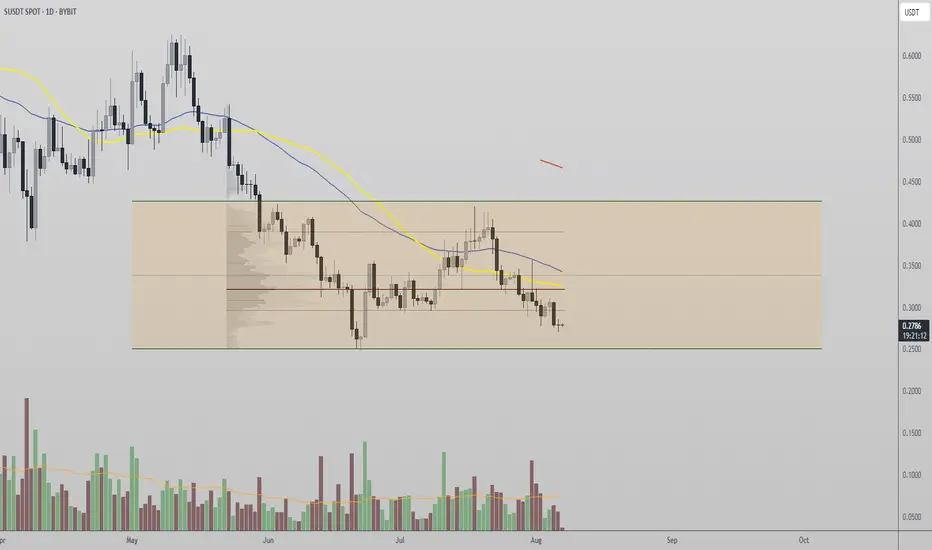
Sonic Token Stuck in Range as Accumulation Phase Forms Sonic Token is showing signs of a classic range-bound market structure, with price rotating between the value area high and the value area low. The most recent rejection from range highs has shifted price action back toward the lower boundary of the range. This setup suggests a potential equilibrium
Related pairs
SONIC. USDTNote, that most of the news concerns a number of cryptocurrencies that have grown and are now adjusting their price.
But there are a number of cryptocurrencies for which there is no news.
One of these cryptocurrencies is Sonic.
" No news is good news".
So, it is not too difficult to guess that the f


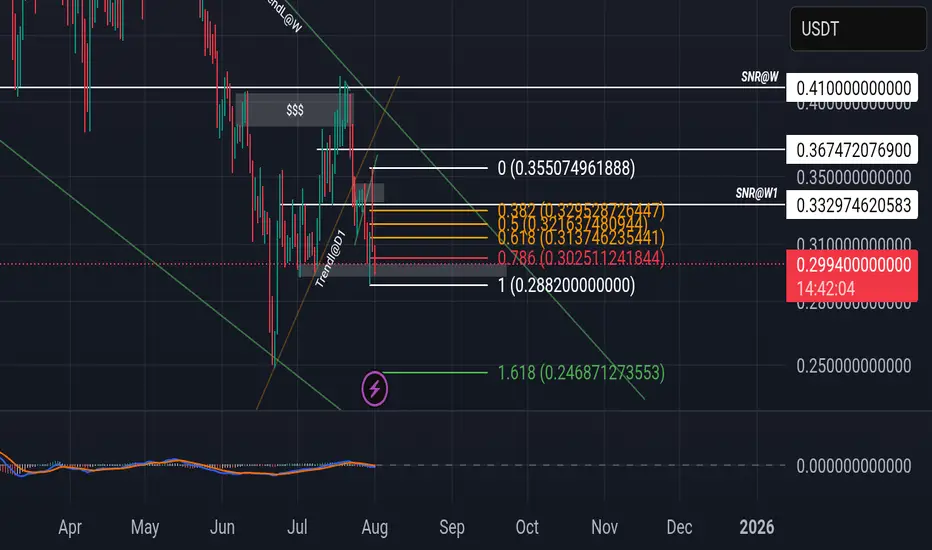
SUSDT: trend in daily time frames ((((( Each of these entries can reach the main TARGET)))))
The color levels are very accurate levels of support and resistance in different time frames, and we have to wait for their reaction in these areas.
So, Please pay special attention to the very accurate trend, colored level
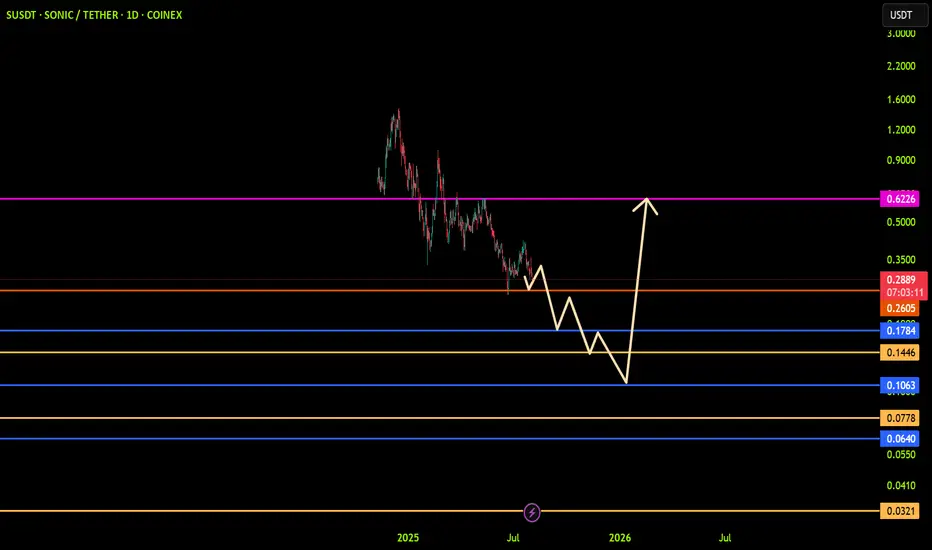
Sonic is creating wedge pattern in higher timeframeOn our current market structure, sonic is creating wedge bullish pattern.
If you check the current price using Fibonacci there's a possibility that it will goes to 0.24 or worst 0.1552 before it will break its current weekly structure.
You can accumulate within the pattern but if you're planning
#SPath to $0.60 — Is It Realistic?
Yes, but it depends on a few key factors:
If Sonic breaks and holds above $0.35, the next realistic targets are:
• Short-term: $0.45–$0.52
• Mid-term: $0.60, especially if burn rates stay high and ecosystem growth continues
ALTSEASON send us Higher.

S - SONIC 1DSonic lacks the buying volume to break through its resistances.
The project, after a name change, has become Matic 2.
I expect that we'll soon reach support levels of 30 cents and 25 cents after the pullback is complete. If these supports are broken, the next support levels will be 20 cents and 17

SONIC. USDTIt's been a long time the current Sonic( S ), and the Fantom of the past have been moving in neutral.
So,
It's time to make a profit for their investors.

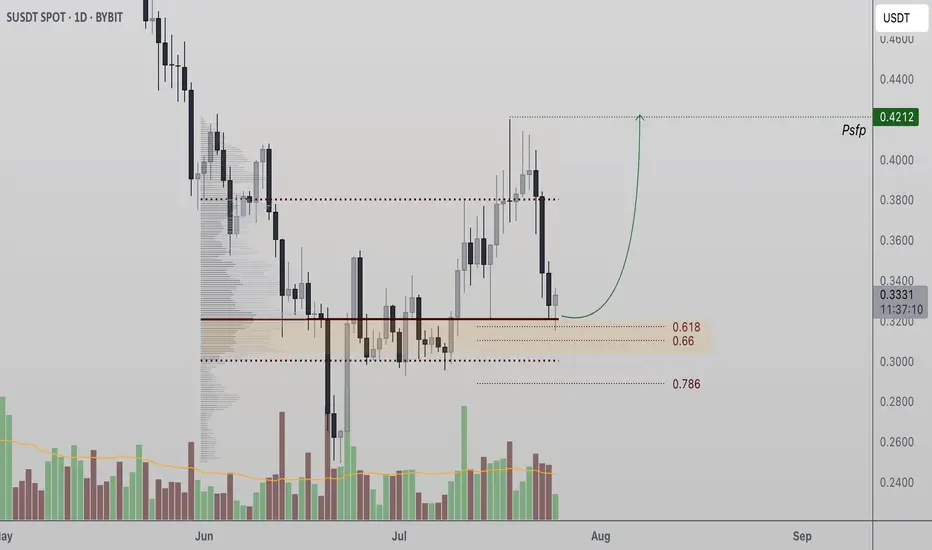
Sonic Token Tests Critical Support at Point of Control Sonic Token (S) is holding a major confluence support zone that could act as the foundation for a bullish reversal. A strong bounce here may lead to a retest of the $0.42 swing high.
Sonic Token (S) has corrected into a significant support region, aligning with both the Point of Control (POC) and t
what daily chart of Sonic tell us? personal idea: Sonic daily chart shows finding and creating bottom around 0.3 price and price reverse is forming, in this scenario targets of
0.5-0.6
0.8-0.9
1-1.2
are in the horizon of bulls
Good 🙂 luck 👍

See all ideas
Summarizing what the indicators are suggesting.
Oscillators
Neutral
SellBuy
Strong sellStrong buy
Strong sellSellNeutralBuyStrong buy
Oscillators
Neutral
SellBuy
Strong sellStrong buy
Strong sellSellNeutralBuyStrong buy
Summary
Neutral
SellBuy
Strong sellStrong buy
Strong sellSellNeutralBuyStrong buy
Summary
Neutral
SellBuy
Strong sellStrong buy
Strong sellSellNeutralBuyStrong buy
Summary
Neutral
SellBuy
Strong sellStrong buy
Strong sellSellNeutralBuyStrong buy
Moving Averages
Neutral
SellBuy
Strong sellStrong buy
Strong sellSellNeutralBuyStrong buy
Moving Averages
Neutral
SellBuy
Strong sellStrong buy
Strong sellSellNeutralBuyStrong buy
Frequently Asked Questions
The current price of S / USDT Spot Trading Pair (S) is 0.2992 USDT — it has risen 0.03% in the past 24 hours. Try placing this info into the context by checking out what coins are also gaining and losing at the moment and seeing S price chart.
S / USDT Spot Trading Pair price has fallen by −1.49% over the last week, its month performance shows a −0.30% decrease, and as for the last year, S / USDT Spot Trading Pair has decreased by −63.32%. See more dynamics on S price chart.
Keep track of coins' changes with our Crypto Coins Heatmap.
Keep track of coins' changes with our Crypto Coins Heatmap.
S / USDT Spot Trading Pair (S) reached its highest price on Feb 21, 2025 — it amounted to 0.9879 USDT. Find more insights on the S price chart.
See the list of crypto gainers and choose what best fits your strategy.
See the list of crypto gainers and choose what best fits your strategy.
S / USDT Spot Trading Pair (S) reached the lowest price of 0.2496 USDT on Jun 22, 2025. View more S / USDT Spot Trading Pair dynamics on the price chart.
See the list of crypto losers to find unexpected opportunities.
See the list of crypto losers to find unexpected opportunities.
The safest choice when buying S is to go to a well-known crypto exchange. Some of the popular names are Binance, Coinbase, Kraken. But you'll have to find a reliable broker and create an account first. You can trade S right from TradingView charts — just choose a broker and connect to your account.
S / USDT Spot Trading Pair (S) is just as reliable as any other crypto asset — this corner of the world market is highly volatile. Today, for instance, S / USDT Spot Trading Pair is estimated as 3.87% volatile. The only thing it means is that you must prepare and examine all available information before making a decision. And if you're not sure about S / USDT Spot Trading Pair, you can find more inspiration in our curated watchlists.
You can discuss S / USDT Spot Trading Pair (S) with other users in our public chats, Minds or in the comments to Ideas.