Morning Star formation on Daily TF but..Morning Star formation on Daily TF.
Monthly Closing above 29 would be a Positive Sign.
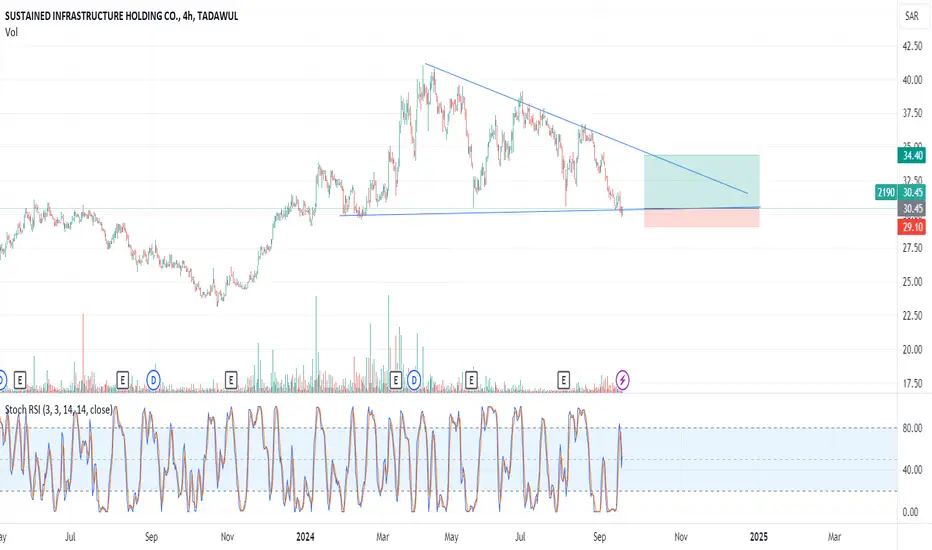
However, 28 - 29 can be a Good Support Zone.
28.50 should not be broken, otherwise further
Selling Pressure can be witnessed.
On the flip side, 32 - 32.50 is an Important Resistance.
However, only Morning Star f
0.55 SAR
−741.88 K SAR
1.32 B SAR
69.38 M
About SUSTAINED INFRASTRUCTURE HOLDING CO.
Sector
Industry
CEO
Khalid Suleimani
Website
Headquarters
Jeddah
Founded
1988
ISIN
SA0007879360
FIGI
BBG000H35L02
Saudi Industrial Services Co. engages in the development, investment, and provision of support services for industrial estates across Saudi Arabia. It operates through the following business segments: Ports, Logistics, and Water. The company was founded on October 18, 1988, and is headquartered in Jeddah, Saudi Arabia.
Related stocks

Double BottomDouble Bottom with Bullish Divergence.
34 (if sustained) can be a Good Entry Point
with a Stoploss of 31.

21902190 is trading in fine bullish trend and maintaining well the bullish trendline.
Whenever the price retest the bullish trendline buyers are attacking aggressively, which can be seen from the chart.
Currently the price is above trend line and touching to the inclining trendline around 21.50 ( consid

Sisco might carry on upside I can see a flag pattern which is continuation pattern .. The target Target and the stop loss is on the chart.

TASI: Saudi Industerial 2190 1H setup4300 1H Setup
1-Trend is bullish
2- volumes are high
3- Next resistance is at 29.01
4- next support is at 27.15
5- RSI is overbought but going back into 70
6- expected to have small retrace or stay
in this level for few days and then take bullish run
7- alerts are added to get entry at the right ti

I recommend 2190 for purchaseHello guys , according to my graphical analysis of SAUDI INDUSTRIAL SERVICES CO. , there is a high probability of an increase towards over 38$ in the next few days

See all ideas
Summarizing what the indicators are suggesting.
Oscillators
Neutral
SellBuy
Strong sellStrong buy
Strong sellSellNeutralBuyStrong buy
Oscillators
Neutral
SellBuy
Strong sellStrong buy
Strong sellSellNeutralBuyStrong buy
Summary
Neutral
SellBuy
Strong sellStrong buy
Strong sellSellNeutralBuyStrong buy
Summary
Neutral
SellBuy
Strong sellStrong buy
Strong sellSellNeutralBuyStrong buy
Summary
Neutral
SellBuy
Strong sellStrong buy
Strong sellSellNeutralBuyStrong buy
Moving Averages
Neutral
SellBuy
Strong sellStrong buy
Strong sellSellNeutralBuyStrong buy
Moving Averages
Neutral
SellBuy
Strong sellStrong buy
Strong sellSellNeutralBuyStrong buy
Displays a symbol's price movements over previous years to identify recurring trends.
Frequently Asked Questions
The current price of 2190 is 26.15 SAR — it has decreased by −2.06% in the past 24 hours. Watch SUSTAINED INFRASTRUCTURE HOLDING CO. stock price performance more closely on the chart.
Depending on the exchange, the stock ticker may vary. For instance, on TADAWUL exchange SUSTAINED INFRASTRUCTURE HOLDING CO. stocks are traded under the ticker 2190.
2190 stock has fallen by −9.52% compared to the previous week, the month change is a −10.14% fall, over the last year SUSTAINED INFRASTRUCTURE HOLDING CO. has showed a −24.53% decrease.
2190 reached its all-time high on Feb 7, 2006 with the price of 90.85 SAR, and its all-time low was 6.50 SAR and was reached on Dec 2, 2008. View more price dynamics on 2190 chart.
See other stocks reaching their highest and lowest prices.
See other stocks reaching their highest and lowest prices.
2190 stock is 2.69% volatile and has beta coefficient of 0.85. Track SUSTAINED INFRASTRUCTURE HOLDING CO. stock price on the chart and check out the list of the most volatile stocks — is SUSTAINED INFRASTRUCTURE HOLDING CO. there?
Today SUSTAINED INFRASTRUCTURE HOLDING CO. has the market capitalization of 2.13 B, it has decreased by −3.26% over the last week.
Yes, you can track SUSTAINED INFRASTRUCTURE HOLDING CO. financials in yearly and quarterly reports right on TradingView.
2190 net income for the last quarter is 24.73 M SAR, while the quarter before that showed 19.32 M SAR of net income which accounts for 27.97% change. Track more SUSTAINED INFRASTRUCTURE HOLDING CO. financial stats to get the full picture.
Yes, 2190 dividends are paid annually. The last dividend per share was 0.40 SAR. As of today, Dividend Yield (TTM)% is 3.06%. Tracking SUSTAINED INFRASTRUCTURE HOLDING CO. dividends might help you take more informed decisions.
EBITDA measures a company's operating performance, its growth signifies an improvement in the efficiency of a company. SUSTAINED INFRASTRUCTURE HOLDING CO. EBITDA is 675.56 M SAR, and current EBITDA margin is 46.68%. See more stats in SUSTAINED INFRASTRUCTURE HOLDING CO. financial statements.
Like other stocks, 2190 shares are traded on stock exchanges, e.g. Nasdaq, Nyse, Euronext, and the easiest way to buy them is through an online stock broker. To do this, you need to open an account and follow a broker's procedures, then start trading. You can trade SUSTAINED INFRASTRUCTURE HOLDING CO. stock right from TradingView charts — choose your broker and connect to your account.
Investing in stocks requires a comprehensive research: you should carefully study all the available data, e.g. company's financials, related news, and its technical analysis. So SUSTAINED INFRASTRUCTURE HOLDING CO. technincal analysis shows the strong sell today, and its 1 week rating is strong sell. Since market conditions are prone to changes, it's worth looking a bit further into the future — according to the 1 month rating SUSTAINED INFRASTRUCTURE HOLDING CO. stock shows the sell signal. See more of SUSTAINED INFRASTRUCTURE HOLDING CO. technicals for a more comprehensive analysis.
If you're still not sure, try looking for inspiration in our curated watchlists.
If you're still not sure, try looking for inspiration in our curated watchlists.