2250: LONG AFTER HAMMER CANDLE FORMATION2250: SAUDI INDUSTRIAL INVESTMENT
has historically appreciated, on a weekly timeframe, once a hammer candle had been formed at an 'area of interest' or below it
The 'area of interest' is the price range of 18.10 - 18.30. There are 2 cases of hammer candle formation: 1) at the area of interest 2) be
Next report date
—
Report period
—
EPS estimate
—
Revenue estimate
—
0.28 SAR
201.24 M SAR
0.00 SAR
679.32 M
About SAUDI INDUSTRIAL INVESTMENT GROUP
Sector
Industry
CEO
Abdul Rahman Saleh Al-Ismail
Website
Headquarters
Riyadh
Founded
1996
ISIN
SA000A0B89Q3
FIGI
BBG000Q4PSD9
Saudi Industrial Investment Group engages in the production and export of petrochemicals. Its products include benzene, cyclohexane, motor gasoline, styrene, propylene, ethylene, polyethylene, polystyrene, and hexane. The company was founded on January 1, 1996 and is headquartered in Riyadh, Saudi Arabia.
Related stocks

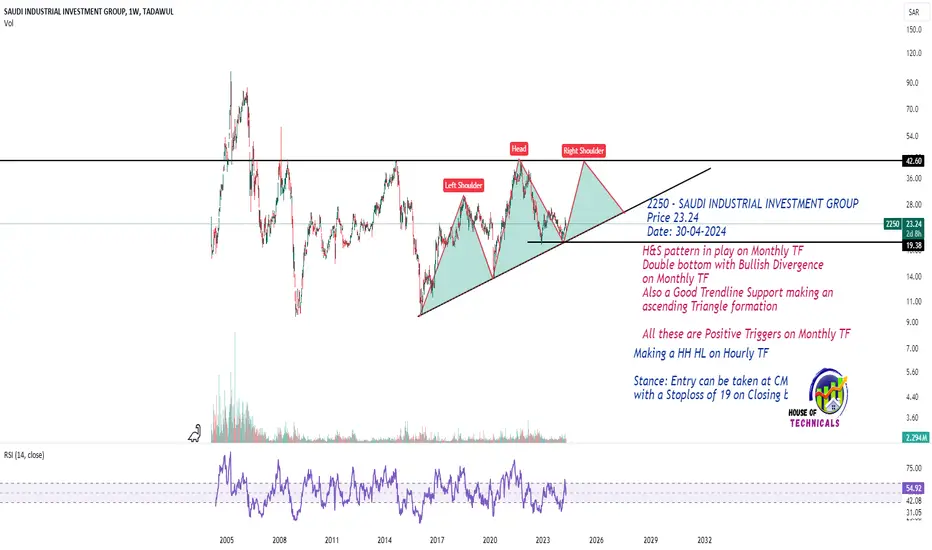
H&S pattern in play on Monthly TF
Double bottom with Bullish Divergence
on Monthly TF
Also a Good Trendline Support making an
ascending Triangle formation
All these are Positive Triggers on Monthly TF
2250|Saudi IndustrialTrading in downtrending channel and descending triangle
For reversal needs to breakout the triangle as well as the channel
Important explanation, support and resistance levels in chart
Good luck!
🤝Please do not forget to support, cheers, likes, comments and boost!
Thanks!

2250: Buy ideaOn 2250 we will have a big probability to have an uptrend because we have the breakout with force the resistance and the vwap by a big green candle with a large green volume.Thanks!

🟢 2250 SAUDI INDUSTRIAL INVESTMENT 🟢NO LIQUDITY SWEAP NO ENTRY.
STRUCTURE IS CHANGING ANYTIME.
EVERY CANDLE HAS LIQUIDITY.
PRICE ALWAYS NEED LIQUIDITY.
Nobody Knows Where is Price Going.
Hey traders, here is the analysi.
If you guys like my analysis please hit like?? and follow.
Thanks.
SMART MONEY CONCEPT.
identify Liquidity Or Becom

SAUDI INDUSTRIAL INVESTMENT GROUP 2250DAILY TIME FRAME STRUCTURE
Nobody Knows Where is Price Going.
Hey traders, here is the analysi.
If you guys like my analysis please hit like?? and follow.
Thanks.
DISCLAIMER- This is not financial advice.
SMART MONEY CONCEPT.
identify Liquidity Or Become Liquidity


Saudi Industrial Investment on W-Analysis.The stock has met all Elliott wave principles and now moving on wave 5. It may, however, retrace a little and continues its bullish wave to target the top of the price channel highlighted. If it penetrates with decent volume, it is going to the second target. The third target is the H&Ss that might

2250 - Possible setup.2250 has been on an upward trend and has recently formed a double bottom on its support level. It's currently trading within the Fib golden pocket.

See all ideas
Summarizing what the indicators are suggesting.
Neutral
SellBuy
Strong sellStrong buy
Strong sellSellNeutralBuyStrong buy
Neutral
SellBuy
Strong sellStrong buy
Strong sellSellNeutralBuyStrong buy
Neutral
SellBuy
Strong sellStrong buy
Strong sellSellNeutralBuyStrong buy
An aggregate view of professional's ratings.
Neutral
SellBuy
Strong sellStrong buy
Strong sellSellNeutralBuyStrong buy
Neutral
SellBuy
Strong sellStrong buy
Strong sellSellNeutralBuyStrong buy
Neutral
SellBuy
Strong sellStrong buy
Strong sellSellNeutralBuyStrong buy
Displays a symbol's price movements over previous years to identify recurring trends.
Frequently Asked Questions
The current price of 2250 is 17.24 SAR — it has increased by 3.86% in the past 24 hours. Watch SAUDI INDUSTRIAL INVESTMENT GROUP stock price performance more closely on the chart.
Depending on the exchange, the stock ticker may vary. For instance, on TADAWUL exchange SAUDI INDUSTRIAL INVESTMENT GROUP stocks are traded under the ticker 2250.
2250 stock has risen by 0.23% compared to the previous week, the month change is a 19.56% rise, over the last year SAUDI INDUSTRIAL INVESTMENT GROUP has showed a −17.75% decrease.
We've gathered analysts' opinions on SAUDI INDUSTRIAL INVESTMENT GROUP future price: according to them, 2250 price has a max estimate of 17.50 SAR and a min estimate of 16.60 SAR. Watch 2250 chart and read a more detailed SAUDI INDUSTRIAL INVESTMENT GROUP stock forecast: see what analysts think of SAUDI INDUSTRIAL INVESTMENT GROUP and suggest that you do with its stocks.
2250 reached its all-time high on Mar 31, 2005 with the price of 100.48 SAR, and its all-time low was 9.50 SAR and was reached on Nov 24, 2008. View more price dynamics on 2250 chart.
See other stocks reaching their highest and lowest prices.
See other stocks reaching their highest and lowest prices.
2250 stock is 5.77% volatile and has beta coefficient of 0.81. Track SAUDI INDUSTRIAL INVESTMENT GROUP stock price on the chart and check out the list of the most volatile stocks — is SAUDI INDUSTRIAL INVESTMENT GROUP there?
Today SAUDI INDUSTRIAL INVESTMENT GROUP has the market capitalization of 11.71 B, it has decreased by −3.71% over the last week.
Yes, you can track SAUDI INDUSTRIAL INVESTMENT GROUP financials in yearly and quarterly reports right on TradingView.
SAUDI INDUSTRIAL INVESTMENT GROUP is going to release the next earnings report on Jul 29, 2025. Keep track of upcoming events with our Earnings Calendar.
2250 earnings for the last quarter are 0.02 SAR per share, whereas the estimation was 0.07 SAR resulting in a −70.23% surprise. The estimated earnings for the next quarter are 0.07 SAR per share. See more details about SAUDI INDUSTRIAL INVESTMENT GROUP earnings.
SAUDI INDUSTRIAL INVESTMENT GROUP revenue for the last quarter amounts to 0.00 SAR, matching the estimated figure, and no changes in revenue are expected for the next quarter.
2250 net income for the last quarter is 18.23 M SAR, while the quarter before that showed 11.26 M SAR of net income which accounts for 61.96% change. Track more SAUDI INDUSTRIAL INVESTMENT GROUP financial stats to get the full picture.
SAUDI INDUSTRIAL INVESTMENT GROUP dividend yield was 2.99% in 2024, and payout ratio reached 187.56%. The year before the numbers were 4.50% and 672.58% correspondingly. See high-dividend stocks and find more opportunities for your portfolio.
Like other stocks, 2250 shares are traded on stock exchanges, e.g. Nasdaq, Nyse, Euronext, and the easiest way to buy them is through an online stock broker. To do this, you need to open an account and follow a broker's procedures, then start trading. You can trade SAUDI INDUSTRIAL INVESTMENT GROUP stock right from TradingView charts — choose your broker and connect to your account.
Investing in stocks requires a comprehensive research: you should carefully study all the available data, e.g. company's financials, related news, and its technical analysis. So SAUDI INDUSTRIAL INVESTMENT GROUP technincal analysis shows the strong buy rating today, and its 1 week rating is neutral. Since market conditions are prone to changes, it's worth looking a bit further into the future — according to the 1 month rating SAUDI INDUSTRIAL INVESTMENT GROUP stock shows the sell signal. See more of SAUDI INDUSTRIAL INVESTMENT GROUP technicals for a more comprehensive analysis.
If you're still not sure, try looking for inspiration in our curated watchlists.
If you're still not sure, try looking for inspiration in our curated watchlists.