Formed Strong Double bottom around 40.Formed Strong Double bottom around 40.
Immediate Resistance is around 46 - 47
Crossing this level & sustaining with good volumes
may witness 48.50 - 49.
On the flip side, 44 - 44.50 seems to be a Good Support.
Next report date
—
Report period
—
EPS estimate
—
Revenue estimate
—
2.70 SAR
421.87 M SAR
1.68 B SAR
141.42 M
About SAUDI CEMENT CO.
Sector
Industry
CEO
Mohammed bin Ali Abdullah Al-Garni
Website
Headquarters
Dammam
Founded
1955
ISIN
SA0007879469
FIGI
BBG000BHY8R5
Saudi Cement Co. engages in the production and sale of cement and related products. It offers cement clinker, sulfate resistant cement, and ordinary portland cement. The company was founded on November 23, 1955 and is headquartered in Dammam, Saudi Arabia.
Related stocks

Saudi Cement 3030 : Enough falling!Weekly chart, the stock TADAWUL:3030 has been falling for long time, and is near the long-term support line S (around 39.9).
On the intra-day time-frame, the indicators MACD and RSI are showing the rebound has started.
The price should target the Resistance line R - at around 54 passing throug

Saudi cement 3030It will start a new journey to the goals mentioned in the chart. Let’s trust our tools

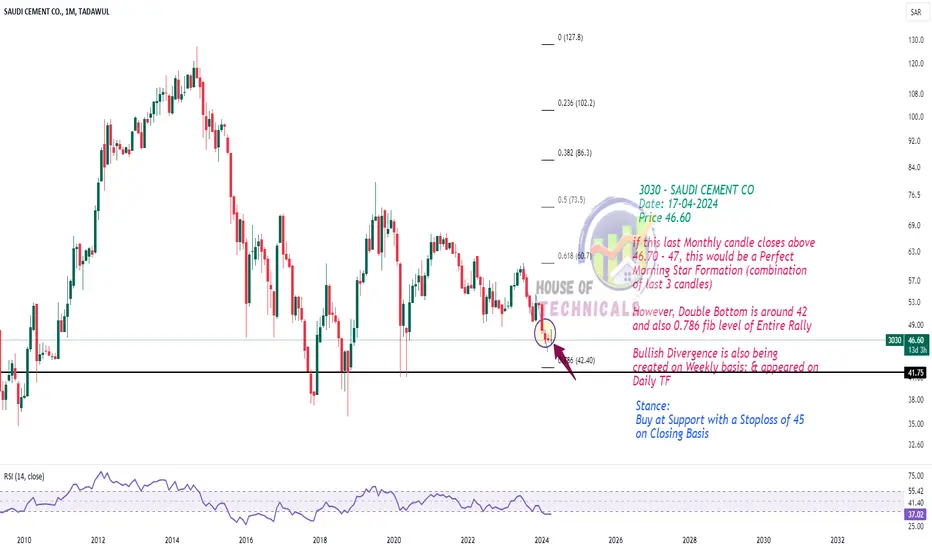
Buy Stanceif this last Monthly candle closes above
46.70 - 47, this would be a Perfect
Morning Star Formation (combination
of last 3 candles)
However, Double Bottom is around 42
and also 0.786 fib level of Entire Rally
Bullish Divergence is also being
created on Weekly basis; & appeared on
Daily TF
SAUDI CEMENT CO 3030Stock in consolidation phase if stock goes upward then we will take position but due to volume still undecided

Will Saudi Cement (3030) cross the resistance and target 61?Weekly chart, Saudi Cement (3030) is trying to complete a chart pattern triangle. After crossing the resistance, the target will be 61.
After crossing the longer-term resistance line (dashed GREY), then the target will be 75, passing through resistance levels 67 and 72
RSI is positive

3030 Saudi Cement COBearish signs downtrend no 200 MA breakout.
49 and 44.5 are good entry if there is bullish signs


ATTENTION ! trading algorithms change the game, and decide to sell
This market will decline strongly this week , I Advais you to Selling at the next red candle
the time is not right to buy
you can only buy after crossing the green line

See all ideas
Summarizing what the indicators are suggesting.
Neutral
SellBuy
Strong sellStrong buy
Strong sellSellNeutralBuyStrong buy
Neutral
SellBuy
Strong sellStrong buy
Strong sellSellNeutralBuyStrong buy
Neutral
SellBuy
Strong sellStrong buy
Strong sellSellNeutralBuyStrong buy
An aggregate view of professional's ratings.
Neutral
SellBuy
Strong sellStrong buy
Strong sellSellNeutralBuyStrong buy
Neutral
SellBuy
Strong sellStrong buy
Strong sellSellNeutralBuyStrong buy
Neutral
SellBuy
Strong sellStrong buy
Strong sellSellNeutralBuyStrong buy
Displays a symbol's price movements over previous years to identify recurring trends.
Frequently Asked Questions
The current price of 3030 is 38.45 SAR — it has increased by 1.32% in the past 24 hours. Watch SAUDI CEMENT CO. stock price performance more closely on the chart.
Depending on the exchange, the stock ticker may vary. For instance, on TADAWUL exchange SAUDI CEMENT CO. stocks are traded under the ticker 3030.
3030 stock has fallen by −3.51% compared to the previous week, the month change is a −7.90% fall, over the last year SAUDI CEMENT CO. has showed a −12.21% decrease.
We've gathered analysts' opinions on SAUDI CEMENT CO. future price: according to them, 3030 price has a max estimate of 55.00 SAR and a min estimate of 42.00 SAR. Watch 3030 chart and read a more detailed SAUDI CEMENT CO. stock forecast: see what analysts think of SAUDI CEMENT CO. and suggest that you do with its stocks.
3030 reached its all-time high on Sep 9, 2014 with the price of 127.00 SAR, and its all-time low was 19.35 SAR and was reached on Mar 12, 2001. View more price dynamics on 3030 chart.
See other stocks reaching their highest and lowest prices.
See other stocks reaching their highest and lowest prices.
3030 stock is 1.32% volatile and has beta coefficient of 0.75. Track SAUDI CEMENT CO. stock price on the chart and check out the list of the most volatile stocks — is SAUDI CEMENT CO. there?
Today SAUDI CEMENT CO. has the market capitalization of 5.88 B, it has decreased by −4.05% over the last week.
Yes, you can track SAUDI CEMENT CO. financials in yearly and quarterly reports right on TradingView.
SAUDI CEMENT CO. is going to release the next earnings report on Aug 12, 2025. Keep track of upcoming events with our Earnings Calendar.
3030 net income for the last quarter is 108.49 M SAR, while the quarter before that showed 120.59 M SAR of net income which accounts for −10.03% change. Track more SAUDI CEMENT CO. financial stats to get the full picture.
SAUDI CEMENT CO. dividend yield was 6.45% in 2024, and payout ratio reached 99.73%. The year before the numbers were 4.76% and 100.39% correspondingly. See high-dividend stocks and find more opportunities for your portfolio.
EBITDA measures a company's operating performance, its growth signifies an improvement in the efficiency of a company. SAUDI CEMENT CO. EBITDA is 644.82 M SAR, and current EBITDA margin is 38.82%. See more stats in SAUDI CEMENT CO. financial statements.
Like other stocks, 3030 shares are traded on stock exchanges, e.g. Nasdaq, Nyse, Euronext, and the easiest way to buy them is through an online stock broker. To do this, you need to open an account and follow a broker's procedures, then start trading. You can trade SAUDI CEMENT CO. stock right from TradingView charts — choose your broker and connect to your account.
Investing in stocks requires a comprehensive research: you should carefully study all the available data, e.g. company's financials, related news, and its technical analysis. So SAUDI CEMENT CO. technincal analysis shows the sell today, and its 1 week rating is sell. Since market conditions are prone to changes, it's worth looking a bit further into the future — according to the 1 month rating SAUDI CEMENT CO. stock shows the strong sell signal. See more of SAUDI CEMENT CO. technicals for a more comprehensive analysis.
If you're still not sure, try looking for inspiration in our curated watchlists.
If you're still not sure, try looking for inspiration in our curated watchlists.