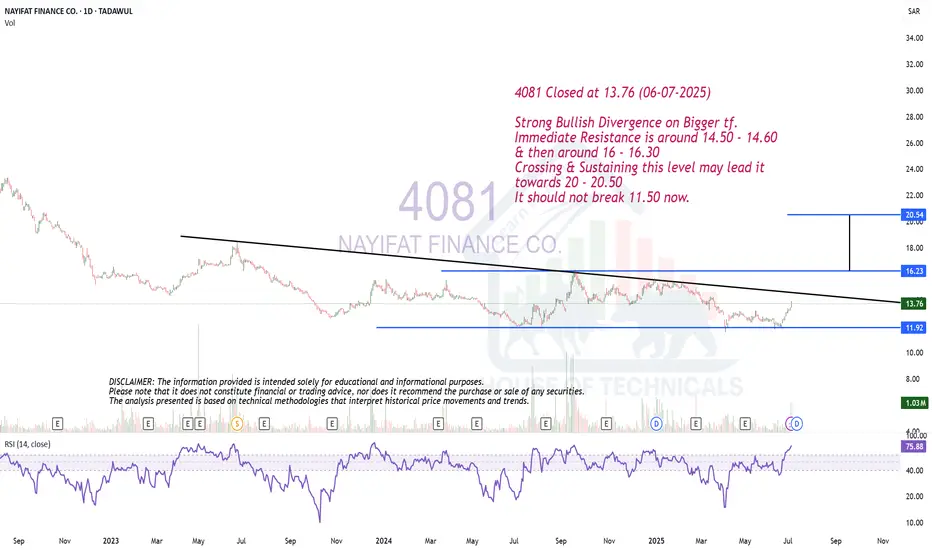
Strong Bullish Divergence on Bigger tf.4081 Closed at 13.76 (06-07-2025)
Strong Bullish Divergence on Bigger tf.
Immediate Resistance is around 14.50 - 14.60
& then around 16 - 16.30
Crossing & Sustaining this level may lead it
towards 20 - 20.50
It should not break 11.50 now.
0.96 SAR
131.24 M SAR
365.48 M SAR
56.27 M
About NAYIFAT FINANCE CO.
Sector
Industry
CEO
Fahd bin Ibrahim Al Mufarrij
Website
Headquarters
Riyadh
Founded
2002
ISIN
SA15DGH1VOH4
FIGI
BBG00NRWGTT7
Nayifat Finance Co. engages in the provision of financial services. It offers consumer finance, credit card finance, small and medium-sized enterprise finance, finance lease, and peer to peer lending. It operates through the following segments: Personal Financing, SME Financing, and Islamic Credit Cards. The company was founded in 2002 and is headquartered in Riyadh, Saudi Arabia.
Related stocks
4081 Naifat Finance (TADAWUL)📊 Trade Idea Overview – Weekly Timeframe
✅ Key Technical Levels:
Demand Zone: Clearly marked between 12.00 – 13.00, showing strong historical buyer interest.
Current Price: 13.38
Fibonacci Retracement Levels: Price is reacting near the 0.705 - 0.79 zone, which often acts as a bullish reversal are

Review of Nayifat Finance Co's Analysis 4081
Nayifat Finance Co. has demonstrated a robust analytical approach in their recent market assessment. Their focus on key trading concepts, including sell-side liquidity, buy-side liquidity, and market structure shifts, reflects a comprehensive understanding of market dynamics.
Sell-Side Liquidity

4081 NAYIFAT FINANCENO LIQUDITY SWEAP NO ENTRY.
STRUCTURE IS CHANGING ANYTIME.
EVERY CANDLE HAS LIQUIDITY.
PRICE ALWAYS NEED LIQUIDITY.
Nobody Knows Where is Price Going.
Hey traders, here is the analysi.
If you guys like my analysis please hit like?? and follow.
Thanks.
SMART MONEY CONCEPT.
identify Liquidity Or Becom

possible scenarios for 4081 Hello traders and investors
As it is figured on my chart there are 2 scenarios, so what you should keep on mind it is the fact that one of these 3 zones should be broken with huge volume and a nice big candle.
We don't have a cristal ball predicting markets but we try to follow the decided market tr

4081 can reverse up after that big rise4081 after reversing up strongly it can, if break up the 33.06 feriously, go up until 34.12 and mybe more just during few days ( this hypothisis is likely hard to be achieved but possible)
otherwise if the other scenario accure it will fall down freely and rapidly during several weeks (that what i

4081 bearish in long termhello
As shown in chart 4081 will fall agressively and mybe it will go down until 31.28
good luck

See all ideas
Summarizing what the indicators are suggesting.
Neutral
SellBuy
Strong sellStrong buy
Strong sellSellNeutralBuyStrong buy
Neutral
SellBuy
Strong sellStrong buy
Strong sellSellNeutralBuyStrong buy
Neutral
SellBuy
Strong sellStrong buy
Strong sellSellNeutralBuyStrong buy
An aggregate view of professional's ratings.
Neutral
SellBuy
Strong sellStrong buy
Strong sellSellNeutralBuyStrong buy
Neutral
SellBuy
Strong sellStrong buy
Strong sellSellNeutralBuyStrong buy
Neutral
SellBuy
Strong sellStrong buy
Strong sellSellNeutralBuyStrong buy
Displays a symbol's price movements over previous years to identify recurring trends.
Frequently Asked Questions
The current price of 4081 is 12.81 SAR — it has decreased by −0.16% in the past 24 hours. Watch NAYIFAT FINANCE CO. stock price performance more closely on the chart.
Depending on the exchange, the stock ticker may vary. For instance, on TADAWUL exchange NAYIFAT FINANCE CO. stocks are traded under the ticker 4081.
4081 stock has fallen by −2.59% compared to the previous week, the month change is a −7.04% fall, over the last year NAYIFAT FINANCE CO. has showed a −1.16% decrease.
We've gathered analysts' opinions on NAYIFAT FINANCE CO. future price: according to them, 4081 price has a max estimate of 10.00 SAR and a min estimate of 10.00 SAR. Watch 4081 chart and read a more detailed NAYIFAT FINANCE CO. stock forecast: see what analysts think of NAYIFAT FINANCE CO. and suggest that you do with its stocks.
4081 reached its all-time high on Nov 22, 2021 with the price of 30.50 SAR, and its all-time low was 11.54 SAR and was reached on Apr 7, 2025. View more price dynamics on 4081 chart.
See other stocks reaching their highest and lowest prices.
See other stocks reaching their highest and lowest prices.
4081 stock is 1.65% volatile and has beta coefficient of 0.68. Track NAYIFAT FINANCE CO. stock price on the chart and check out the list of the most volatile stocks — is NAYIFAT FINANCE CO. there?
Today NAYIFAT FINANCE CO. has the market capitalization of 1.54 B, it has decreased by −0.77% over the last week.
Yes, you can track NAYIFAT FINANCE CO. financials in yearly and quarterly reports right on TradingView.
4081 net income for the last quarter is 15.57 M SAR, while the quarter before that showed 23.55 M SAR of net income which accounts for −33.87% change. Track more NAYIFAT FINANCE CO. financial stats to get the full picture.
NAYIFAT FINANCE CO. dividend yield was 5.37% in 2024, and payout ratio reached 75.90%. The year before the numbers were 0.00% and 0.00% correspondingly. See high-dividend stocks and find more opportunities for your portfolio.
Like other stocks, 4081 shares are traded on stock exchanges, e.g. Nasdaq, Nyse, Euronext, and the easiest way to buy them is through an online stock broker. To do this, you need to open an account and follow a broker's procedures, then start trading. You can trade NAYIFAT FINANCE CO. stock right from TradingView charts — choose your broker and connect to your account.
Investing in stocks requires a comprehensive research: you should carefully study all the available data, e.g. company's financials, related news, and its technical analysis. So NAYIFAT FINANCE CO. technincal analysis shows the sell today, and its 1 week rating is sell. Since market conditions are prone to changes, it's worth looking a bit further into the future — according to the 1 month rating NAYIFAT FINANCE CO. stock shows the sell signal. See more of NAYIFAT FINANCE CO. technicals for a more comprehensive analysis.
If you're still not sure, try looking for inspiration in our curated watchlists.
If you're still not sure, try looking for inspiration in our curated watchlists.