ELM (TADAWUL: 7203) - Double Bottom Breakout SetupThe price action on the 4-hour chart of ELM CO (TADAWUL) has formed a double bottom pattern, signaling a potential bullish reversal.
Trade Idea:
A breakout above 1115.0 confirms the double bottom pattern.
Risk management is crucial – placing SL below bottom at 1048 to ensures controlled risk.
Key
Next report date
—
Report period
—
EPS estimate
—
Revenue estimate
—
25.4 SAR
1.83 B SAR
7.41 B SAR
23.42 M
About ELM CO
Sector
Industry
CEO
Mohammed Abdulaziz Ibrahim Al Omair
Website
Headquarters
Riyadh
Founded
1986
ISIN
SA15GG53GHH3
FIGI
BBG014BFQ5S4
Elm Co. provides integrated digital solutions and e-government services. Its business includes: Product Suite: Ready-to-use solutions in the form of technical services, portals, electronic applications and related support work. Digital Custom Solution: provides integrated technology business solutions to public and private customers. Professional Services: Includes consulting and professional services in data analysis and artificial intelligence. Business Process Outsourcing: provides management and full operation or partial support of services in specific areas and the gradual shift to digital visualization and Nationalization and Up Skilling: provides recruitment processes to fill available vacancies in the labor market. The company was founded in 1986 and is headquartered in Riyadh, Kingdom of Saudi Arabia.
Related stocks

Elm (TADAWUL: 7203) – Key Gann Levels in Play!Elm has been on a rollercoaster ride, experiencing a strong uptrend before hitting resistance and pulling back. The stock is now trading around 1,059 SAR, testing a key 360° Gann level at 1,015 SAR. So, what’s next? Let’s dive in!
Could be the scenario ;)
🔍 Technical Breakdown:
🔹 Resistance Levels:

Long SetupCup & Handle Formation along with Ascending Triangle.
Good to Buy at Mentioned Entry Point.

Elm Stock Warning for BuyersElm Stock Warning for Buyers
Reason: No new FVGs, indicating reduced bullish momentum.
Warning: Buyers should be cautious as the price nears mitigated FVGs or Supply Zones.
Action: Avoid new entries until clear confirmation of demand resurgence or breakout above key levels.
Observation: Watch for b

Though Still Bullish but ...Though Still Bullish but there is a
Bearish Divergence on Monthly as well
as Weekly Time Frame; so one should stay
Cautious.
To remain Bullsih, it should Cross & Sustain
1190 - 1193. & if this level is Sustained, we
may witness 1380 - 1400+.
On the flip side, if 1000 is broken, we may see
Trend Re

7203: Strong SupportELM has been in correction for a while.
Bullish trend has started in recent past (Parallel Channel breakout).
Price is in consolidation at a strong support level.
Entry can be taken now with
Conservative SL or Aggressive SL
Manage your risk and trail SL

7203The price is currently testing 200 day EMA with the closing price of 842.4 in the last trading session. Moving forward, if this level sustains then a possible pull back can be seen in its price with the initial resistance lies around 954 and secondary resistance level lies around 1,003. Use stop los

7203The price action is in uptrend making higher highs and higher lows and currently pulls back from 100 day EMA and currently testing 50 day EMA and closes at 942 in the last trading session. Initial resistance lies around 1,000 and secondary resistance lies around 1,120, upon breaching these levels th

Bearish Divergence on Weekly TF
890 - 900 may act as a Good Support
Stoploss should be below 890 on
closing basis
Targeting around 930 - 950

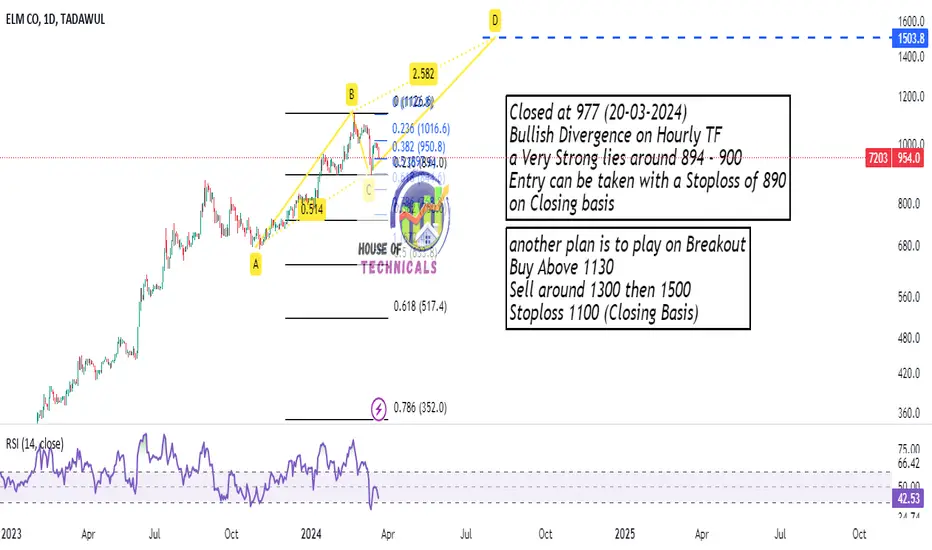
Should wait for Breakout?Closed at 977 (20-03-2024)
Bullish Divergence on Hourly TF
a Very Strong lies around 894 - 900
Entry can be taken with a Stoploss of 890
on Closing basis
See all ideas
Summarizing what the indicators are suggesting.
Neutral
SellBuy
Strong sellStrong buy
Strong sellSellNeutralBuyStrong buy
Neutral
SellBuy
Strong sellStrong buy
Strong sellSellNeutralBuyStrong buy
Neutral
SellBuy
Strong sellStrong buy
Strong sellSellNeutralBuyStrong buy
An aggregate view of professional's ratings.
Neutral
SellBuy
Strong sellStrong buy
Strong sellSellNeutralBuyStrong buy
Neutral
SellBuy
Strong sellStrong buy
Strong sellSellNeutralBuyStrong buy
Neutral
SellBuy
Strong sellStrong buy
Strong sellSellNeutralBuyStrong buy
Displays a symbol's price movements over previous years to identify recurring trends.
Frequently Asked Questions
The current price of 7203 is 930.8 SAR — it has increased by 3.70% in the past 24 hours. Watch ELM CO stock price performance more closely on the chart.
Depending on the exchange, the stock ticker may vary. For instance, on TADAWUL exchange ELM CO stocks are traded under the ticker 7203.
7203 stock has fallen by −2.98% compared to the previous week, the month change is a −13.81% fall, over the last year ELM CO has showed a 10.15% increase.
We've gathered analysts' opinions on ELM CO future price: according to them, 7203 price has a max estimate of 1,475.00 SAR and a min estimate of 1,060.00 SAR. Watch 7203 chart and read a more detailed ELM CO stock forecast: see what analysts think of ELM CO and suggest that you do with its stocks.
7203 reached its all-time high on Jan 22, 2025 with the price of 1,289.0 SAR, and its all-time low was 140.8 SAR and was reached on Feb 16, 2022. View more price dynamics on 7203 chart.
See other stocks reaching their highest and lowest prices.
See other stocks reaching their highest and lowest prices.
7203 stock is 5.35% volatile and has beta coefficient of 1.09. Track ELM CO stock price on the chart and check out the list of the most volatile stocks — is ELM CO there?
Today ELM CO has the market capitalization of 72.33 B, it has decreased by −4.71% over the last week.
Yes, you can track ELM CO financials in yearly and quarterly reports right on TradingView.
ELM CO is going to release the next earnings report on Aug 4, 2025. Keep track of upcoming events with our Earnings Calendar.
7203 earnings for the last quarter are 6.29 SAR per share, whereas the estimation was 5.88 SAR resulting in a 6.89% surprise. The estimated earnings for the next quarter are 6.91 SAR per share. See more details about ELM CO earnings.
ELM CO revenue for the last quarter amounts to 1.88 B SAR, despite the estimated figure of 1.97 B SAR. In the next quarter, revenue is expected to reach 2.46 B SAR.
7203 net income for the last quarter is 495.73 M SAR, while the quarter before that showed 497.61 M SAR of net income which accounts for −0.38% change. Track more ELM CO financial stats to get the full picture.
ELM CO dividend yield was 0.67% in 2024, and payout ratio reached 31.90%. The year before the numbers were 0.86% and 40.10% correspondingly. See high-dividend stocks and find more opportunities for your portfolio.
EBITDA measures a company's operating performance, its growth signifies an improvement in the efficiency of a company. ELM CO EBITDA is 2.05 B SAR, and current EBITDA margin is 25.93%. See more stats in ELM CO financial statements.
Like other stocks, 7203 shares are traded on stock exchanges, e.g. Nasdaq, Nyse, Euronext, and the easiest way to buy them is through an online stock broker. To do this, you need to open an account and follow a broker's procedures, then start trading. You can trade ELM CO stock right from TradingView charts — choose your broker and connect to your account.
Investing in stocks requires a comprehensive research: you should carefully study all the available data, e.g. company's financials, related news, and its technical analysis. So ELM CO technincal analysis shows the sell today, and its 1 week rating is strong sell. Since market conditions are prone to changes, it's worth looking a bit further into the future — according to the 1 month rating ELM CO stock shows the sell signal. See more of ELM CO technicals for a more comprehensive analysis.
If you're still not sure, try looking for inspiration in our curated watchlists.
If you're still not sure, try looking for inspiration in our curated watchlists.