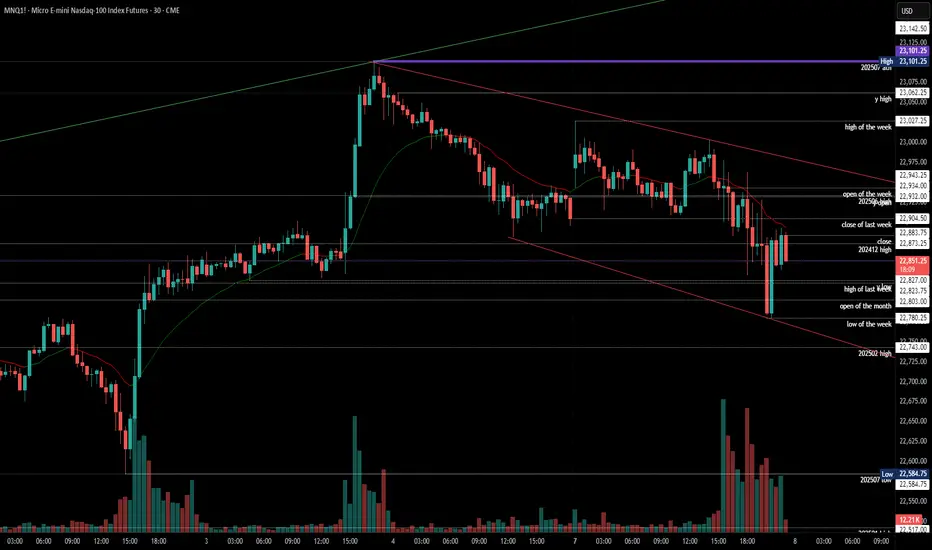
Nasdaq ready to dropwe can see the formation of a ressistance zone in daily, and as we explore the chart the best trade for todaty is a short.
targets are in green. entry zone in blue.
have fun
all details are explained in the video.
Elektra
UNF1! trade ideas

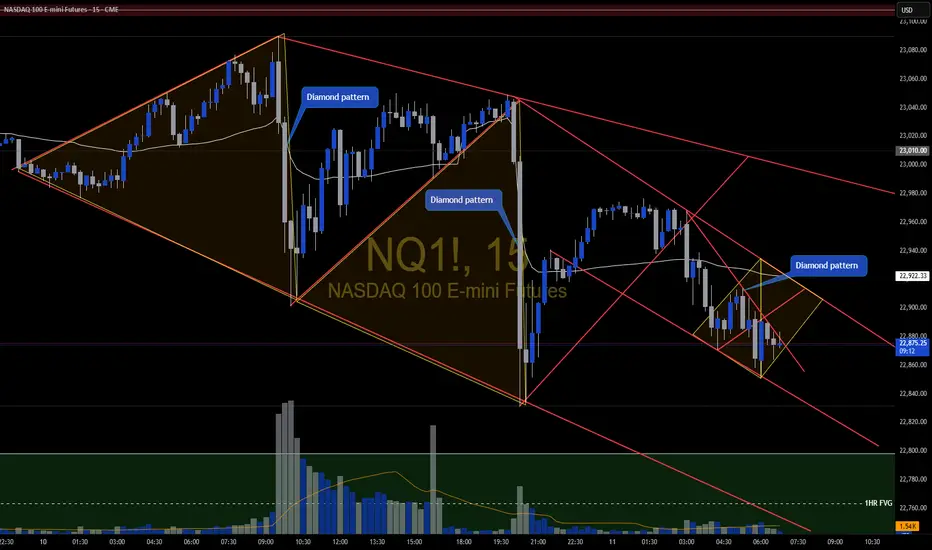
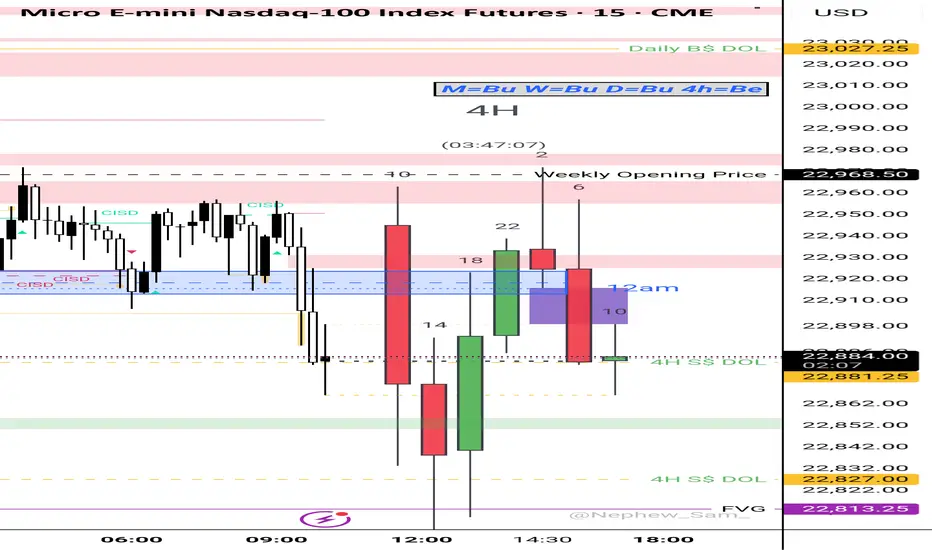
NQ Diamond Repeating patterns You can see the formation of the diamond patterns keep repeating. Big moves come from these. Enter after confirmation & retest.
NQ Power Range Report with FIB Ext - 7/11/2025 SessionCME_MINI:NQU2025
- PR High: 23039.75
- PR Low: 23004.50
- NZ Spread: 78.75
No key scheduled economic events
High 200+ range volatility during Asian hours
Session Open Stats (As of 1:35 AM 7/11)
- Session Open ATR: 301.79
- Volume: 48K
- Open Int: 268K
- Trend Grade: Neutral
- From BA ATH: -0.6% (Rounded)
Key Levels (Rounded - Think of these as ranges)
- Long: 23239
- Mid: 21525
- Short: 20383
Keep in mind this is not speculation or a prediction. Only a report of the Power Range with Fib extensions for target hunting. Do your DD! You determine your risk tolerance. You are fully capable of making your own decisions.
BA: Back Adjusted
BuZ/BeZ: Bull Zone / Bear Zone
NZ: Neutral Zone

A Bearish July for Nasdaq?I hadn’t anticipated the -212 point move unfolding during the After Hours session—I'd mapped that reaction for the upcoming New York AM session open. That said, with momentum already in play, I’m maintaining my short bias. Price appears poised to revisit the July lows, with a high probability of trading through them and pressing further beneath the Monthly VWAP. I’m eyeing continuation to the downside as long as structure confirms the move.

NASDAQ – Decision Point is Now: Breakout or Breakdown?📈🔍 NASDAQ at Key Inflection – Momentum or Meltdown? ⚠️💥
Hey Traders,
The NASDAQ 100 is now standing right at the make-or-break zone: 22,655. This level marks a critical retest of the recent breakout, and what happens here could define the next major move.
🔵 The Setup:
After a strong bounce and sharp rally from below 18K, we've climbed back into the tight ascending structure. But momentum is slowing…
This zone could produce either a bullish continuation to new highs — or a brutal rejection that unwinds the entire move.
📍 Structure Speaks:
Holding above 22,655 = likely continuation
Breakdown = deeper pullback toward 20,000 and lower channel support
Momentum names like NVIDIA are doing the heavy lifting again — but can they sustain the market alone?
📊 What I'm Watching:
Bullish path = measured target ~25,000+
Bearish path = test of the broader trendline near 20,000 or even the 18,200 region
Macro signals still mixed — stay nimble, not married to one bias
⚠️ Stay Sharp:
Just like in crypto, the Nasdaq can punish both bulls and bears when it enters chop mode. Structure and discipline remain your best defense.
I’ve updated the chart — fresh out the oven 🍞 — and more market ideas are following, including BTC, ETH, and BTC Dominance.
One Love,
The FXPROFESSOR 💙
Disclosure: I am happy to be part of the Trade Nation's Influencer program and receive a monthly fee for using their TradingView charts in my analysis. Awesome broker, where the trader really comes first! 🌟🤝📈

NQ Power Range Report with FIB Ext - 7/10/2025 SessionNQ Power Range Report with FIB Ext - 7/10/2025 Session
CME_MINI:NQU2025
- PR High: 23065.25
- PR Low: 23033.25
- NZ Spread: 71.5
Key scheduled economic events:
08:30 | Initial Jobless Claims
13:00 | 30-Year Bond Auction
Session Open Stats (As of 12:35 AM 7/10)
- Session Open ATR: 300.61
- Volume: 20K
- Open Int: 270K
- Trend Grade: Neutral
- From BA ATH: -0.4% (Rounded)
Key Levels (Rounded - Think of these as ranges)
- Long: 23239
- Mid: 21525
- Short: 20383
Keep in mind this is not speculation or a prediction. Only a report of the Power Range with Fib extensions for target hunting. Do your DD! You determine your risk tolerance. You are fully capable of making your own decisions.
BA: Back Adjusted
BuZ/BeZ: Bull Zone / Bear Zone
NZ: Neutral Zone

NASDAQ analysis NASDAQ has been making ATH regularly. We analyise to see where to take entry based on price action.

2025-07-09 - priceactiontds - daily update - nasdaqGood Evening and I hope you are well.
comment: Bears just need to do more. As long as we are not leaving behind bear gaps, bulls keep buying the dips. Wait for long pullbacks if we keep making higher lows. The bull channel is also still valid.
current market cycle: bull trend
key levels: 22700 - 23300
bull case: As long as Bulls stay comfortably above 22500, they are fine and sideways is a very bullish correction for them. Bears are certainly not doing much, so bulls buy every dip. Nothing changed. Might go up to 23300 or higher. No one knows where it will end but it’s likely orange face will end it and he will make sure he announces it in his private Epstein-and-Friends signal group in advance. Some put options 3-6m are fine to buy I think.
Invalidation is below 22700.
bear case: Bears are just not doing enough. Need something below 22700 and most likely an event to be the catalyst for it. I will leave it at that.
Invalidation is above 23500.
short term: Neutral until US-EU tariff shit show get’s a nice tweet or so. We will go down hard again. Be patient.
medium-long term - Update from 2024-06-29: No change in plans. I expect 20000 to get hit over the next 3 months and maybe 19000 again.
trade of the day: Long US open was a bit obvious but buying the huge drop was not.

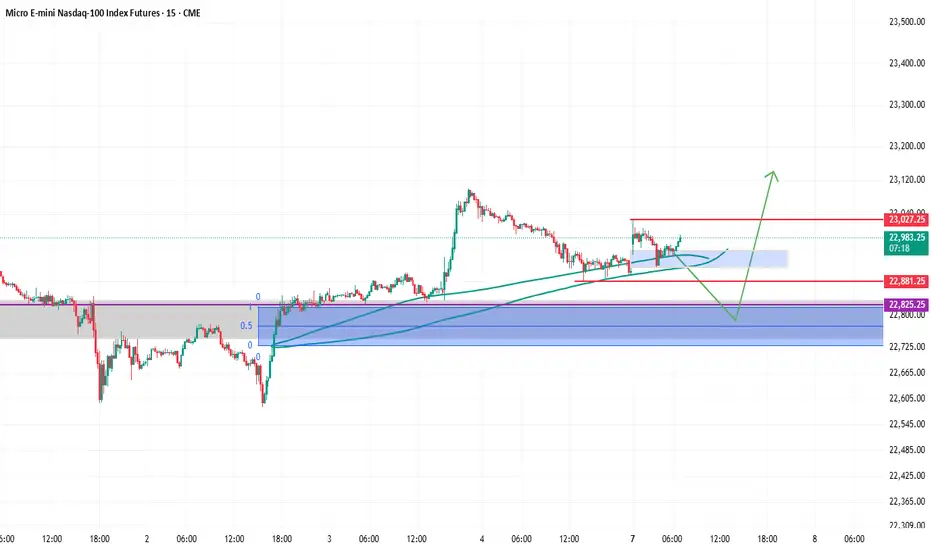
MNQ setups Ok, So since i just woke up so i wont describe much on this chart.
What i would like to see is the following, price retraces to the blue box (where there is too much liq before that blue box), then continue upwards.
also if the price just closes above 23000, then its also good to wait until the price reaches back to 22860 and then go long from there.
You can also take some counter trend trades in between if the price doesn't show momentum to continue upwards. That would happen if the price closes below 22900.
NQ Futures Weekly Plan – Major Liquidity Zones Mapped”📍 Weekly Outlook – NQ (NQU2025)
Week of July 8 | 30-Min Chart | HTF Trend: Bullish
🔼 Key Resistance Zones
ATH – 23,102.50
‣ Major liquidity draw and psychological level
22,935 zone
‣ Prior Thursday and Monday highs
‣ HTF rejection or continuation zone
Watch for LTF sweeps or CHoCH before fading strength
🔽 Key Support Zones
22,785 area
‣ WED LO, SUN HI, and FVG confluence
‣ Ideal HTF bullish continuation zone
22,582 (Monday Low)
‣ First downside liquidity target
22,455 (Sunday Low)
‣ Deep sweep zone if trend weakens
📌 Strategy Notes
✅ Align with HTF structure – current trend remains bullish unless 22,582 fails
🔍 Use LTF (1m–5m) for precision entries only after HTF levels are tested or swept
⏰ Focus on session timing (NY Open, London) for true intent
🧠 Reminder:
Don’t let LTF noise shake your bias.
HTF sets the trap. LTF gives you the trigger.
Stay patient. Trade clean.
🔖 Hashtags:
#NQ #FuturesTrading #OrderFlow #SmartMoney #ICTConcepts #LiquiditySweep #HTFvsLTF #Nasdaq100 #PriceAction #PlaymakerTrading

NQ Analysis ICT Liquidity Search Break-Out TradePrice is expected to open not just 1, but inside 2 previous days.
We have 2 options:
1) ICT silver bullet up my bum trader strategy traders are waiting
for liquidity search breaking highs or lows then reversing.
2) Break-out trades waiting for price to break and close above or below
24hour range and trade in direction of break-out.

NQ Power Range Report with FIB Ext - 7/9/2025 SessionCME_MINI:NQU2025
- PR High: 22923.00
- PR Low: 22900.50
- NZ Spread: 50.5
Key scheduled economic events:
10:30 | Crude Oil Inventories
13:00 | 10-Year Note Auction
14:00 | FOMC Meeting Minutes
Session Open Stats (As of 12:25 AM 7/9)
- Session Open ATR: 303.33
- Volume: 16K
- Open Int: 270K
- Trend Grade: Neutral
- From BA ATH: -0.8% (Rounded)
Key Levels (Rounded - Think of these as ranges)
- Long: 23239
- Mid: 21525
- Short: 20383
Keep in mind this is not speculation or a prediction. Only a report of the Power Range with Fib extensions for target hunting. Do your DD! You determine your risk tolerance. You are fully capable of making your own decisions.
BA: Back Adjusted
BuZ/BeZ: Bull Zone / Bear Zone
NZ: Neutral Zone

NASDAQ – Will It Hold or Collapse Further?📉🔥 NASDAQ Approaching Max Pain – Will It Hold or Collapse Further? 🚀⚠️
The NASDAQ 100 is hanging by a thread, as price approaches the key 19,106 support level. A breakdown from here could accelerate losses toward the 18,283 zone, and if things get worse, the dreaded 16,732 "Max Pain" level may be tested.
📊 Key Technical Levels:
📌 19,106 – First major support (bounce or breakdown zone).
📌 18,283 – Next key level if sellers take control.
📌 16,732 – The "Max Pain" zone, where long-term buyers may step in.
📌 15,347 – Ultimate demand zone if things spiral out of control.
🚨 Why Is Nasdaq Falling?
Tech stocks are getting destroyed, with Tesla leading the plunge.
Market panic over higher interest rates & economic uncertainty.
Bitcoin also struggling, highlighting broader risk-off sentiment.
💡 Will we see a relief rally from these levels, or is the bloodbath just getting started?
Drop your thoughts below!
One Love,
The FXPROFESSOR 💙
#Nasdaq #StockMarketCrash #TechStocks #Trading #MarketAnalysis

10a4h PO3 Monthly Bias = Bullish
Weekly Bias = Bullish
Daily Bias = Bullish
4h PO3 Bias = Bearish
Entry = Sweep of 15m Liquidity or Tap of 15m SIBI > 3m -CISD > Retest of 3m -CISD OB
Stop = 1$ above 3m -CISD OB 👀
NQ Trend & possible patternNQ looks like it's trying to make a few INV H&S Patterns. Wait for your conformations & remember the trend is your friend.

Trade idea - Powell concept
Bearish Bias coming into the day, had a low close Previous day. PXL & PXH indicates price will go lower.
IF we take out the EQH and tap the rejection block, i would not be mad to take a short there. Targeting NDOG, not mad if it gonna be a lose either :)

NQ Power Range Report with FIB Ext - 7/8/2025 SessionCME_MINI:NQU2025
- PR High: 22853.50
- PR Low: 22808.50
- NZ Spread: 100.5
No key scheduled economic events
Session Open Stats (As of 12:25 AM 7/8)
- Session Open ATR: 318.85
- Volume: 24K
- Open Int: 269K
- Trend Grade: Neutral
- From BA ATH: -0.8% (Rounded)
Key Levels (Rounded - Think of these as ranges)
- Long: 23239
- Mid: 21525
- Short: 20383
Keep in mind this is not speculation or a prediction. Only a report of the Power Range with Fib extensions for target hunting. Do your DD! You determine your risk tolerance. You are fully capable of making your own decisions.
BA: Back Adjusted
BuZ/BeZ: Bull Zone / Bear Zone
NZ: Neutral Zone

If we are still bullish futures look to expect these levels. If we are still trending bullish a return back to the old gap low found in the fib & the fvg within the 1hr time fractal .. with a continuation of higher futures - we can see the level delineating in gray lines are my upside targets to see want to reprice to in a order to continue higher.

NASDAQ Futures: My Plan for current Week (7-11 July, 2025)Week: July 7–11, 2025
Instrument: NASDAQ Futures (NQ)
Trend: Overall, the market remains bullish, but for this week I anticipate a retracement targeting the $22,582 level.
Bias for the week: Bearish
Overview:
This week, I’m watching NQ for a potential move toward the $22,582 level. This expectation is based on how Thursday (July 3, 2025) played out—specifically the buy-side liquidity that was taken, and the clean sell-side liquidity pool left near $22,582.
I also find it notable how the NWOG (New Week Opening Gap) was opened and how price moved below it, which reinforces the short bias.
I would consider opening a short position once I see a confirmed 4H candle close below $22,760, otherwise no trades will be taken.
* Trade execution details will be published separately if my bias confirms.
* for more information -> review my notes on the chart

From daveteaches 001Waited 9am - 10am
Give a 9am 1 hr candle zone with Fibonacci level.
Slight pullback from 0.3 and all the way down.

AMP Futures - How to enable the floating data window.In this idea we will demonstrate how to access the new floating data window using TradingView.

2025-07-07 - priceactiontds - daily update - nasdaqGood Evening and I hope you are well.
comment: Market is ignoring every risk under the sun because the US government is too incompetent to follow-through with their excrement show. Beyond me that we are staying up high. Got no better comment for you today.
current market cycle: bull trend
key levels: 22500 - 23100
bull case: As long as bulls stay comfortably above 22500, they are fine and sideways is a very bullish correction for them. Bears are certainly not doing much, so bulls buy every dip and the chances of a new ath are there since we are very close to it.
Invalidation is below 22500.
bear case: Bears are just not doing enough. Markets have every reason to sell hard but they don’t. Unless we see big 1h bear bars closing on their low with follow-through selling, we can not expect lower prices. We need gaps but all bears get are huge reversal bars. Below 22500 things would look better for them but for now it’s very unlikely. It’s certainly a start that we closed a 4h bar below the 4h 20ema and below last week’s close but unless we make lower lows, it does not mean much.
Invalidation is above 23100.
short term: Neutral.
medium-long term - Update from 2024-06-29: No change in plans. I expect 20000 to get hit over the next 3 months and maybe 19000 again.
trade of the day: Scalping both sides since we had many alternating bars and prominent tails.