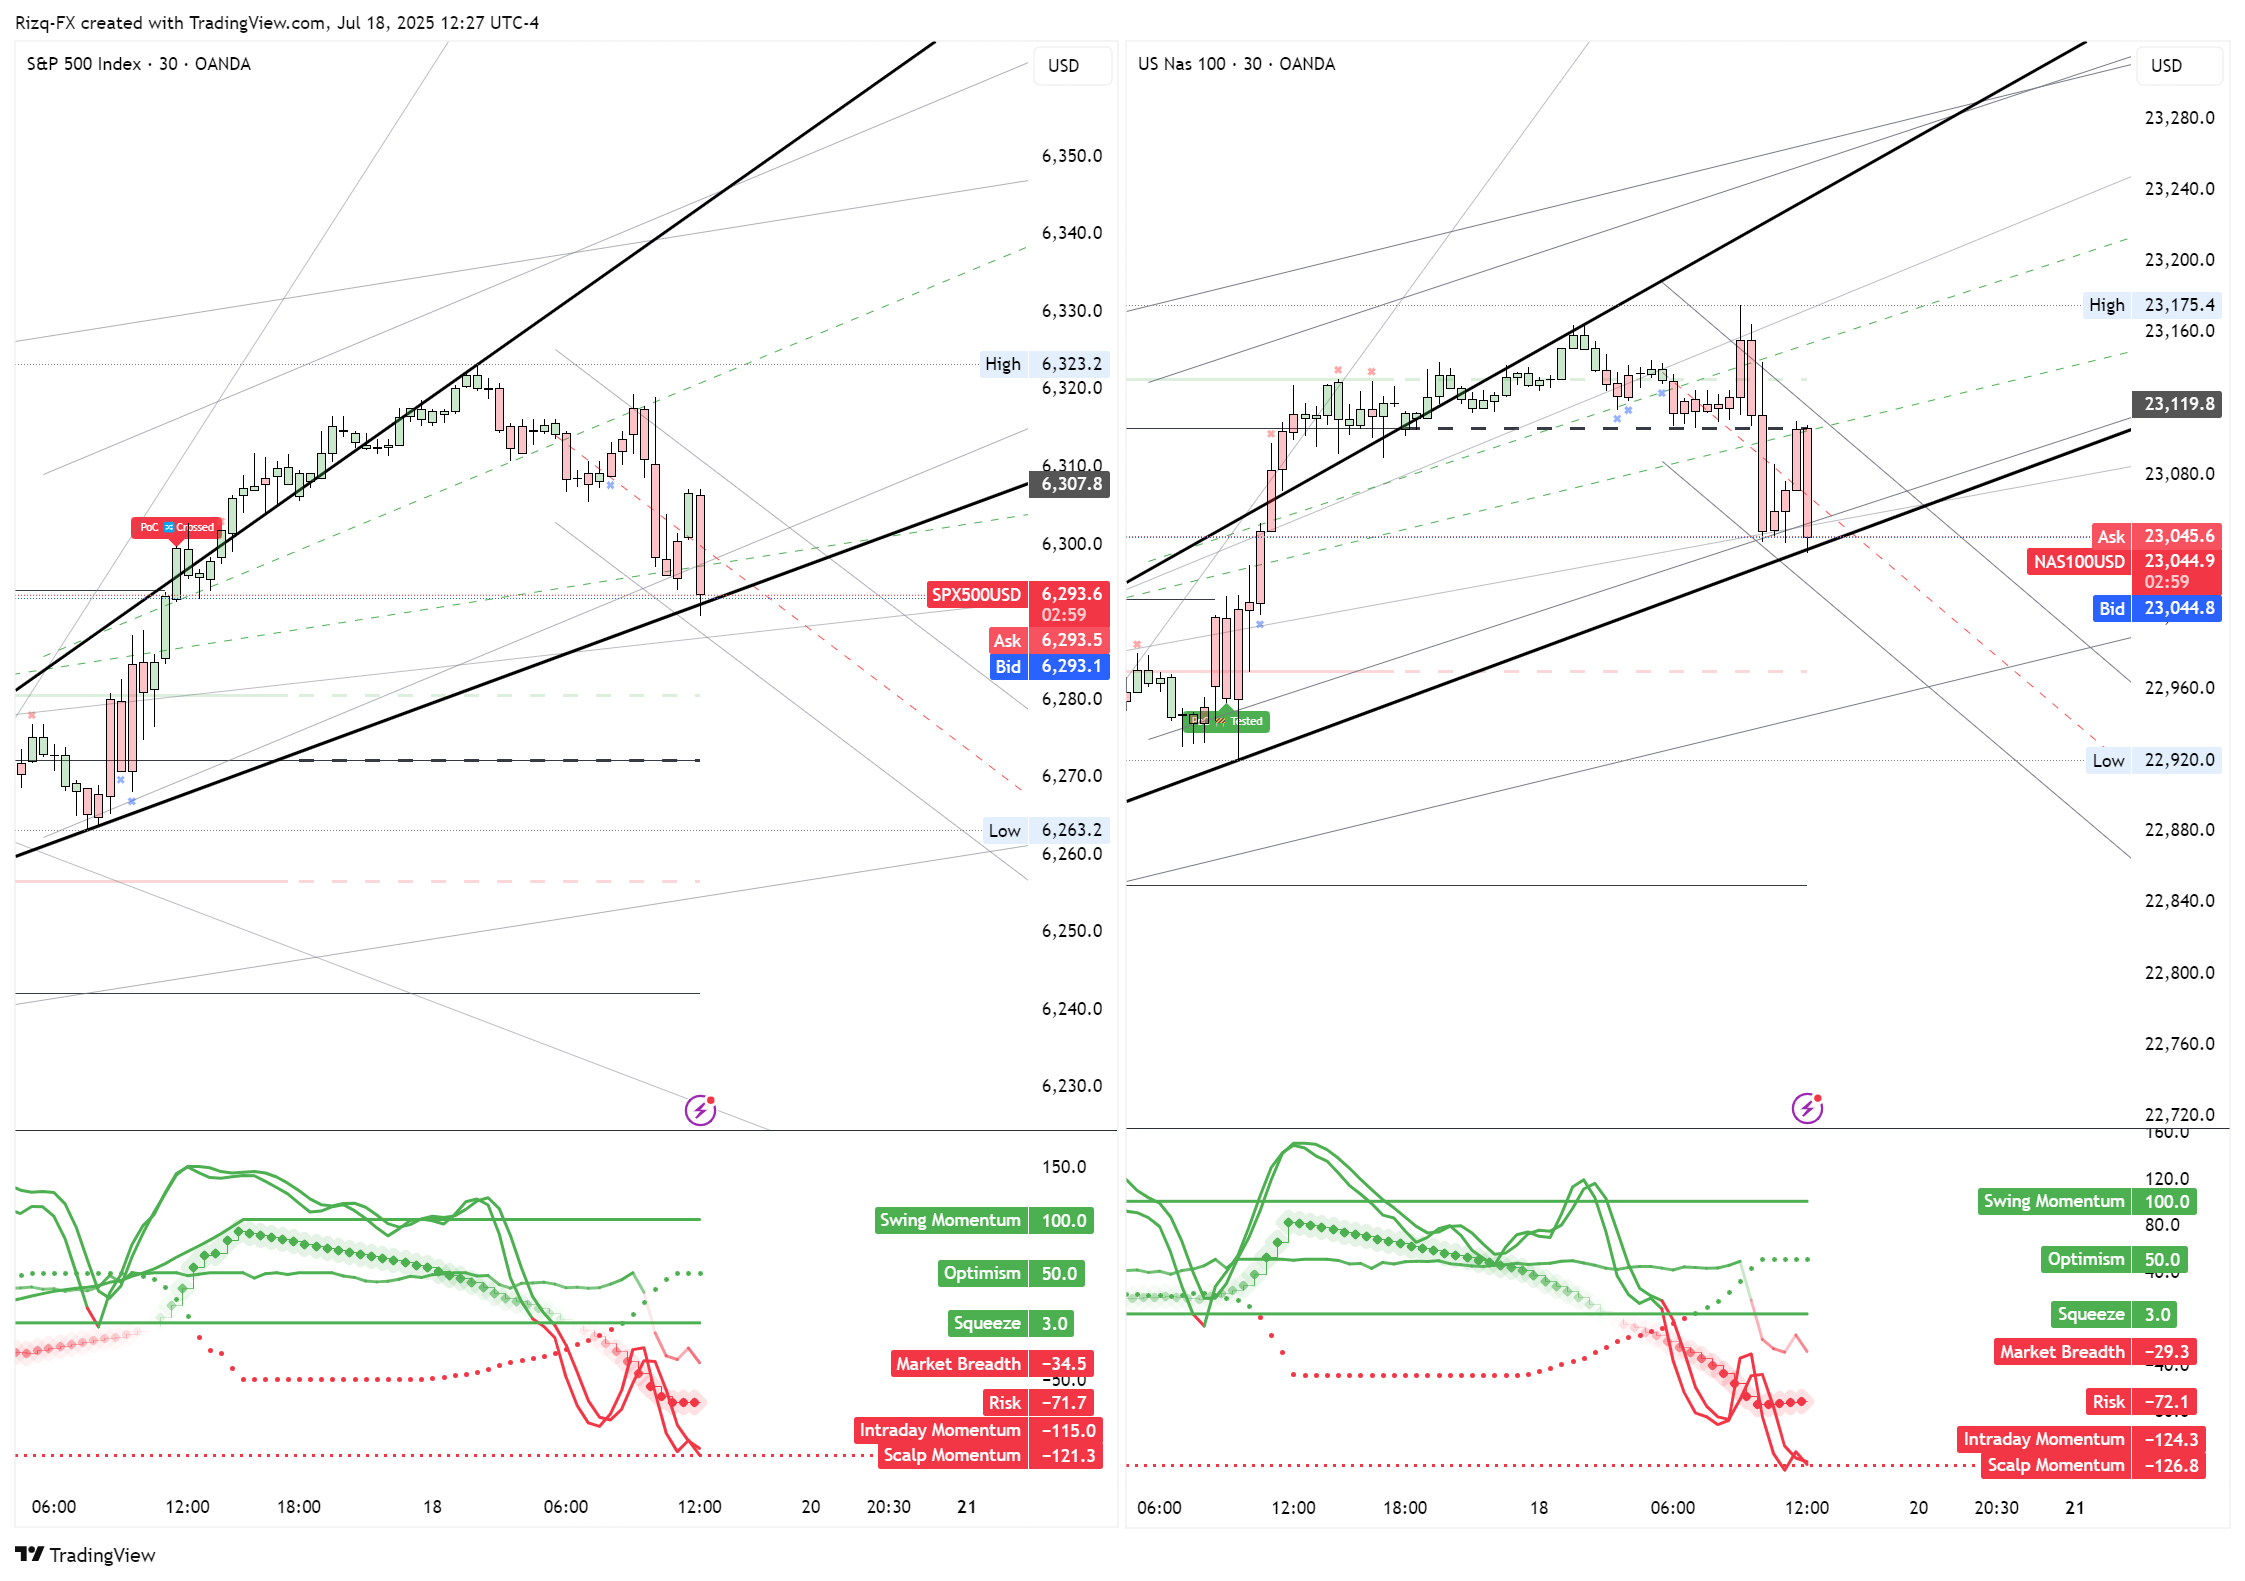
🔍 Flow Notes: • SPX: Macro-positive but still compression-bound. No vol escape yet. • NDX: Flat but stable. Relative strength vs SPX holds. • BTC: Cracked. +2% turned –2.2% = full sentiment reversal. • Gold: Climbing on disinflation beats = flow turning defensive. • DXY: No reaction. Suggests macro already priced or ignored.
🎯 Trade Ideas: • 🟢 Long Bias: Silver — Macro-sweet spot asset, leading tactically. • 🔴 Short Bias: BTC — Failed breakout + macro beat rejection = signal break. • ⚖️ Neutral: SPX — All the right data, none of the move.
━━━━━━━━━━━━━━━━━━━━━━━━━━━━━━━━━━━━━━━━━━━━━━ Best Wishes and Success to All 🛡️ Take Profits, Not Chances. 💰 Manage Risk to Accumulate. 🎯 React with Clarity, Not Hope. 🌊 Flow with Intelligence, Not Noise.
⚙️ Views are Personal & Educational, reflective of our Analysis and Research. 🎯 Summary posts only. Full context via DM. ⚠️ Educational content only. Not investment advice. 📉 Macro Pulse data reflects releases as of July 18, 2025
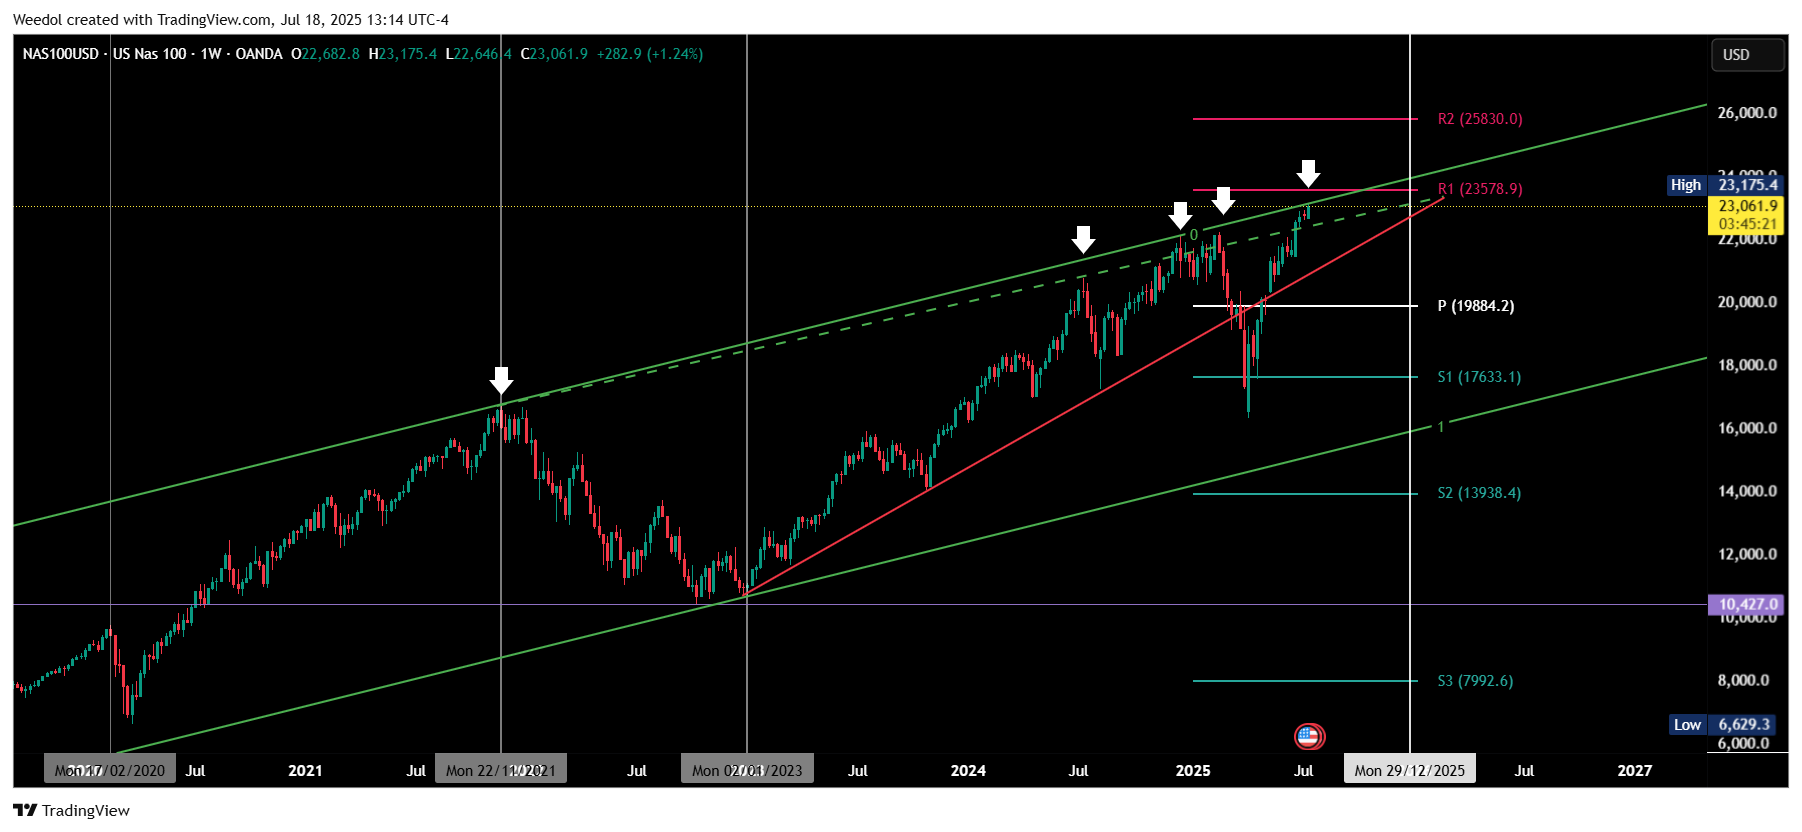
US100 I have to say I'm starting to get tired of seeing Trump appear in the media every day, both his name and his face. It's a kind of celebrity effect where you start to get sick of it. Why didn't America at least elect some hot milf? Next time ban old men from candidature.
NAS100 | Company | Ticker | Has Reported? | Earnings Date (Q2/Next Q) | |------------|--------|----------------|-----------------------------------| | Netflix | NFLX | ✅ Yes | July 17, 2025 (Q2’) | | Apple | AAPL | ❌ No | July 31, 2025 (Q3 est.) | | Microsoft | MSFT | ❌ No | July 30, 2025 (Q4 FY25 est.) | | Meta | META | ❌ No | July 30, 2025 (Q2 FY25 est.) | | Amazon | AMZN | ❌ No | Late July 2025 (est.) | | NVIDIA | NVDA | ❌ No | Late July/Early Aug 2025 (est.) | | Alphabet A | GOOGL | ❌ No | Late July 2025 (est.) | | Alphabet C | GOOG | ❌ No | Late July 2025 (est.) | | Tesla | TSLA | ❌ No | Late July 2025 (est.) | | Others | — | ❌ No | Late July–Early Aug 2025 (est.) |